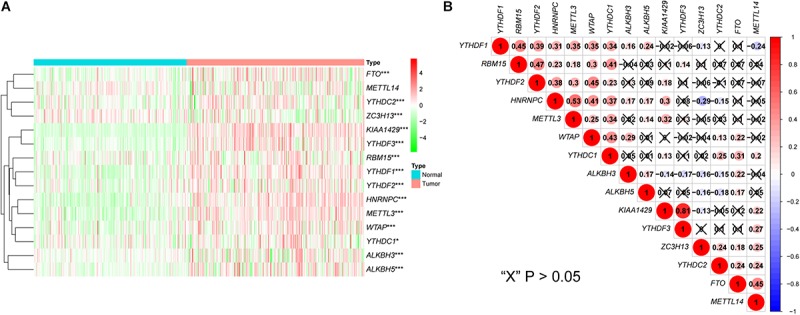
FIGURE 1.

Expression and correlation of m6A-related genes in liver cancer. (A) The expression levels of 15 m6A-related genes in liver cancer (Normal = 199, Tumor = 231). The heatmap shows the fold changes, with green indicates down-regulated genes, and red indicates up-regulated genes. (B) Pearson’s correlation analysis of the 15 m6A-related genes. Blue indicates significant negative correlation and red indicates positive. *P < 0.05, **P < 0.01, ***P < 0.001.
