
FIGURE 5.
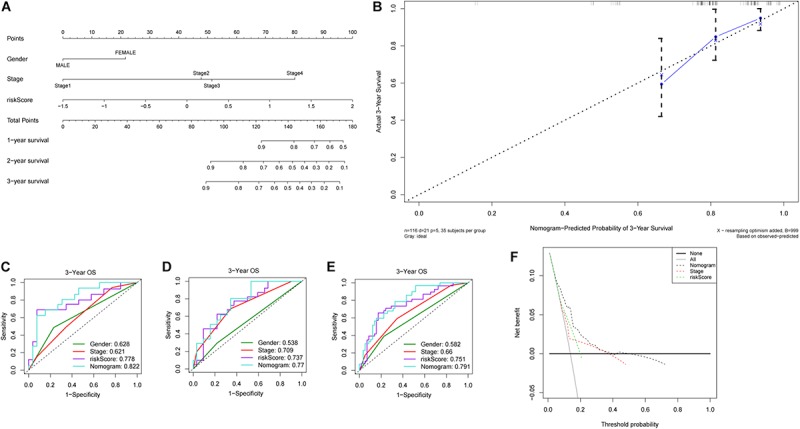
Construction and validation of nomogram. (A) Nomogram predicting 1-, 2- and 3-year OS of patients with liver cancer. (B) Calibration plot for predicting patient OS at 3-year. ROC curves of the nomogram and clinicopathological factors for 3-year OS prediction in the (C) training cohort, (D) validation cohort and (E) entire cohort. (F) Decision curves of the nomogram, tumor stage and riskScore for predicting OS.