
FIGURE 6.
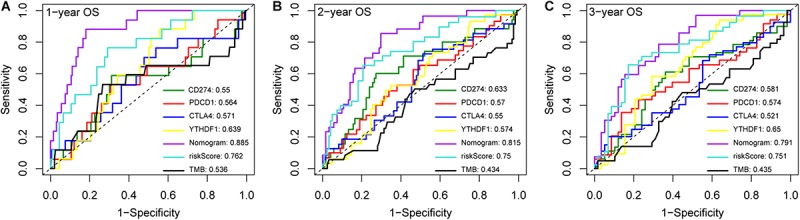
Compare the AUC values of the nomogram with different biomarkers. ROC curves of the nomogram and different biomarkers for (A) 1-, (B) 2- and (C) 3-year overall survival prediction in LIRI-JP cohort.
Official websites use .gov
A
.gov website belongs to an official
government organization in the United States.
Secure .gov websites use HTTPS
A lock (
) or https:// means you've safely
connected to the .gov website. Share sensitive
information only on official, secure websites.
Compare the AUC values of the nomogram with different biomarkers. ROC curves of the nomogram and different biomarkers for (A) 1-, (B) 2- and (C) 3-year overall survival prediction in LIRI-JP cohort.