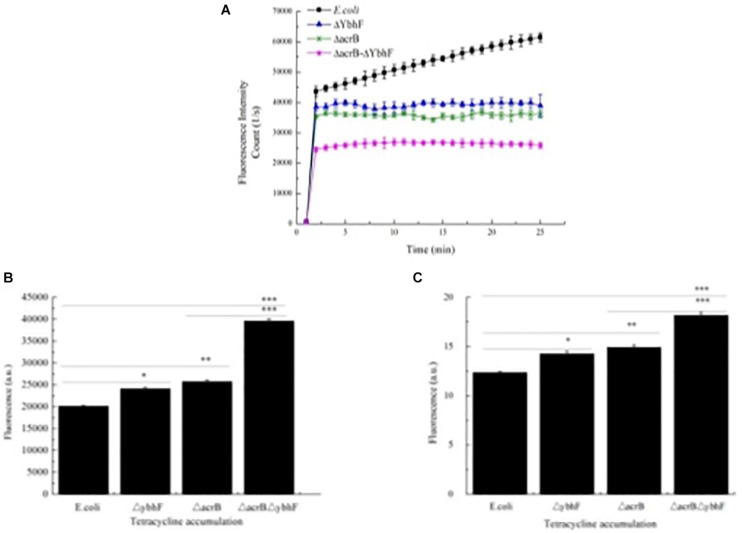
FIGURE 5.
Tetracycline efflux and accumulation assays. (A) Tetracycline efflux. Bacteria were loaded with tetracycline and efflux measured using spectrofluorometry, there was a slower efflux from the E. coliΔacrB, E. coliΔybhF than in the E. coli cells, the outflow speed is the slowest in E. coliΔacrBΔybhF strains. (B) Tetracycline accumulation. Bacteria were loaded with tetracycline, pelleted, and resuspended in Mg2+ buffer, in which released fluorescence (direct measurement of accumulated tetracycline) was immediately detected with a spectrofluorometer. The fluorescence was detected at excitation of 400 nm (9-mm slit), and emission was monitored at 520 nm (20-mm slit). (C) Total accumulation of tetracycline determined after conversion into anhydrotetracycline. The anhydrotetracycline was measured by absorbance at 440 nm. Tetracycline efflux and accumulation assays were repeated three times. ∗p < 0.05; ∗∗p < 0.01; and ∗∗∗p < 0.001. Data are expressed as the mean ± standard deviation.

