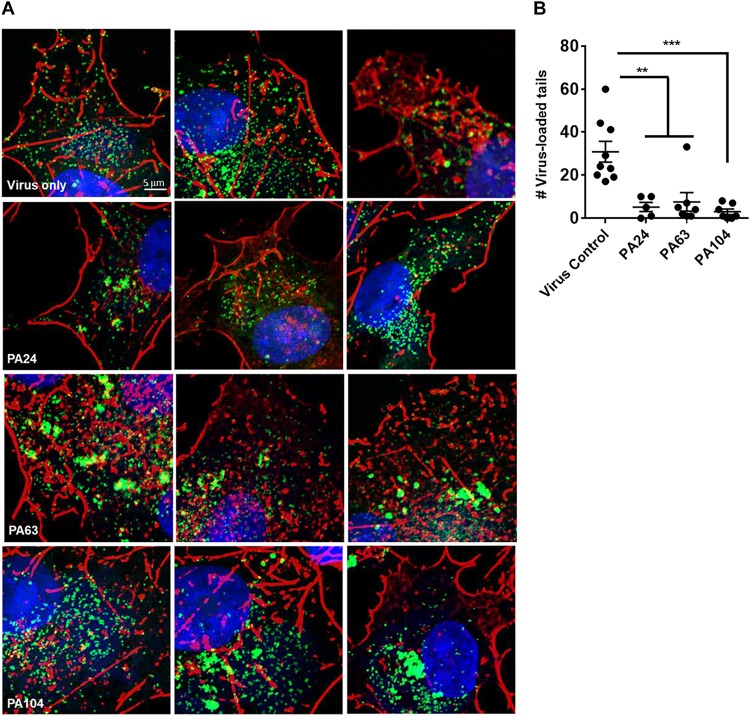
FIGURE 4.
Inhibition of EV formation visualized by actin staining. (A) Confocal microscopy images of cells infected with VACV WR A4-YFP virus in the presence or absence of Retro-1 analogs PA63, PA24, and PA104. Few to no virus-loaded actin tails observed in the presence of Retro-1 analogs in comparison to virus-only treatment. Nuclei, actin, and VACV are stained blue, red, and green, respectively. Scale bars represent 5 μm. (B) Average number of virus-loaded actin tails per cell for each treatment. For each condition, virus-loaded actin tails from five to nine cells were counted (virus control: 9, PA24: 5, PA63: 9, and PA104: 7). Each dot represents one cell, and the average ± SEM for all four conditions are shown. Results of one-way analysis of variance and post hoc Tukey multiple-comparisons test comparing the four treatments are described: **p ≤ 0.005 and ***p ≤ 0.0005.

