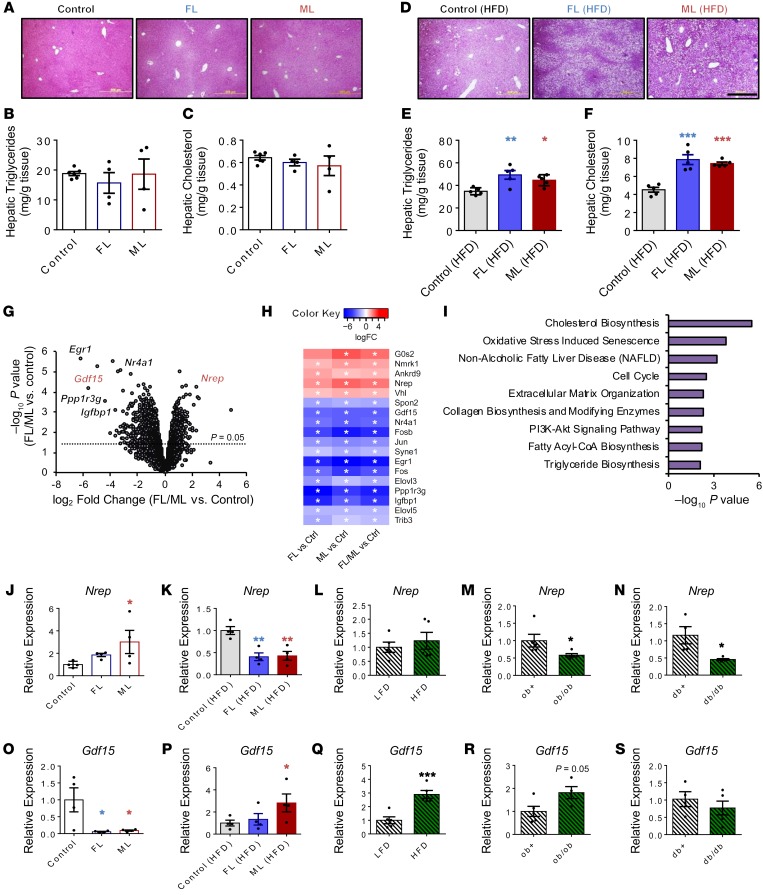
Figure 3. Hepatic transcriptome of NAFLD-primed offspring reveals Nrep and Gdf15.
(A) H&E-stained liver sections from offspring on chow diet (original magnification, ×200; scale bar: 200 μm). (B) Hepatic triglyceride content in chow-diet offspring. (C) Hepatic cholesterol content in chow-diet offspring. Selected-pathway analyses of differentially expressed genes. (D) H&E-stained liver sections from offspring on HFD (original magnification, ×200; scale bar: 200 μm). (E) Hepatic triglyceride content in HFD offspring. (F) Hepatic cholesterol content in HFD offspring. (G) Volcano plot RNA sequencing representation of differently expressed genes (chow: control, n = 4; FL, n = 3; ML, n = 3). (H) Heatmap representation of the most significantly altered genes. (I) Selected-pathway analyses of altered genes in FL and ML compared with controls. (J and K) Hepatic Nrep gene expression analyses by quantitative PCR (qPCR) on chow (J) and HFD (K) at 12 weeks of age (chow and HFD: n = 4 litters/group). (L) Hepatic Nrep mRNA by qPCR in mice challenged with a 6-week low-fat diet (LFD) and HFD at 12 weeks of age (LFD and HFD: n = 5, diet intervention of 6 weeks). (M and N) Hepatic Nrep mRNA levels by qPCR in ob/ob (M) and db/db mice (N) at 12 weeks of age (n = 5 per group). (O and P) Hepatic Nrep gene expression analyses by qPCR in FL, ML, and controls on chow (O) and HFD (P) (chow and HFD: n = 4 litters/group). (Q) Hepatic Nrep mRNA by qPCR in mice challenged with a 6-week LFD and HFD (LFD and HFD: n = 5, diet intervention of 6 weeks). (R and S) Hepatic Nrep mRNA levels by qPCR in ob/ob (R) and db/db mice (S) at 12 weeks of age (n = 5). Unless otherwise stated: chow: control, n = 8, 3 litters; FL, n = 11, 4 litters; ML, n = 5, 3 litters; HFD: control, FL, and ML, n = 6, 3 litters per group. RNA sequencing data were based on control (n = 4 mice/litters), FL (n = 3 mice/litters), and ML (n = 3 mice/litters). One-way ANOVA with Holm-Šidák multiple-comparisons test; 2-tailed unpaired t test in L–N and Q–S. *P < 0.05; **P < 0.01; ***P < 0.001. In H, asterisk indicates FDR < 0.25 in FL and FDR < 0.10 in ML and FL/ML comparisons.

