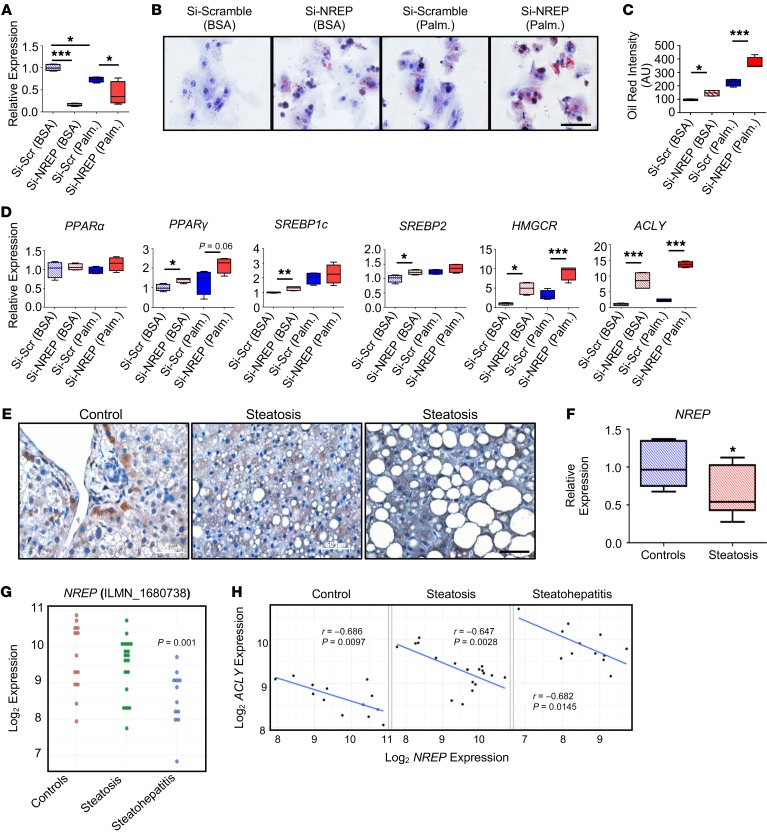
Figure 6. NREP relevance in human hepatic steatosis.
(A) NREP knockdown in human primary hepatocytes (n = 3 independent experiments, hepatocytes from 5 pooled healthy donors). (B) Representative oil red staining showing lipid droplets in human primary hepatocytes treated with BSA or challenged with palmitate for 24 hours (n = 3 independent experiments; original magnification, ×400; scale bar: 50 μm). (C) Quantification of oil red staining intensity (n = 3 independent experiments). (D) RT-PCR analyses of genes involved in β-oxidation (PPARα), transcriptional regulation of fatty acid (PPARγ, SREBP1c) and cholesterol (SREBP2) metabolism, and acyl-CoA (ACLY) and cholesterol synthesis (HMGCR) (n = 3 independent experiments, hepatocytes from 5 pooled healthy donors). (E and F) NREP protein (E) and mRNA (F) levels in human liver samples from controls and patients with steatosis (control, n = 7; steatosis, n = 8; Supplemental Table 6). (G) Hepatic mRNA levels in controls and steatosis and steatohepatitis patients by microarrays (GSE33814). (H) Pearson’s correlations between NREP and ACLY mRNA levels in all groups in controls, steatosis, and steatohepatitis. Significance in comparisons between 2 groups was determined by 2-way ANOVA with Holm-Šidák multiple-comparisons test in A, 1-way ANOVA with Holm-Šidák multiple-comparisons test in C and D, 2-tailed unpaired t test in F, Benjamini-Hochberg method (see Methods) in G, and Pearson’s correlations in H. *P < 0.05; **P < 0.01; ***P < 0.001. All data are shown as mean ± SEM.

