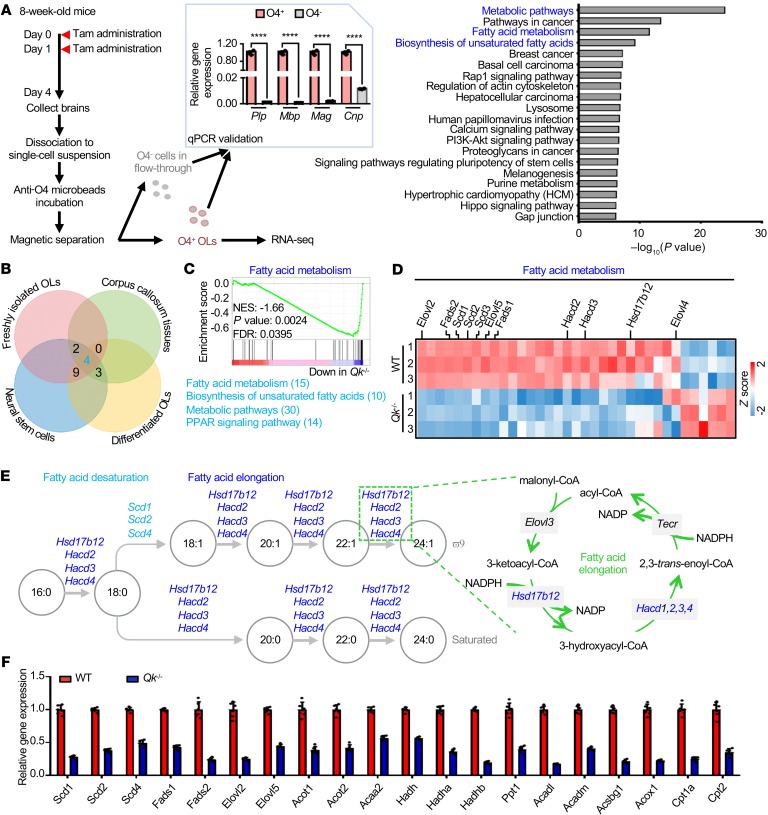
Figure 3. Qki regulates the transcription of genes involved in fatty acid metabolism.
(A) Schema depicting the workflow for the fresh isolation of oligodendrocytes from Qk-iCKO mice and controls for RNA-seq (left). n = 3 mice/group. After being validated by RT-qPCR (middle), the O4+ oligodendrocytes (OLs) were used for RNA-seq. Bar graph (right) shows the top 20 enriched pathways. Tam, tamoxifen. (B) Venn diagram depicting the overlap among the top 50 enriched pathways identified from the RNA-seq of freshly isolated mouse OLs, differentiated OLs, NSCs, and adult corpus callosum. The numbers of common genes overlapped in more than 3 cell/tissue types are shown next to individual pathways. (C) GSEA shows the fatty acid metabolism signature in freshly isolated mouse oligodendrocytes. NES, normalized enrichment score; FDR, false discovery rate. (D) Heatmap representing the differentially expressed genes involved in fatty acid metabolism in freshly isolated OLs. (E) Schema depicting desaturating and elongating reactions of fatty acids with the corresponding enzymes. The reduction in fatty acid desaturases is shown in light blue, and the reduction in enzymes of the fatty acid elongation cycle is shown in dark blue. (F) RT-qPCR validation of the differentially expressed genes involved in fatty acid metabolism in WT and Qki-depleted (Qk–/–) differentiated oligodendrocytes. Data are representative of 3 independent experiments (F). Data are mean ± SD. ****P < 0.0001 by Student’s t test.

