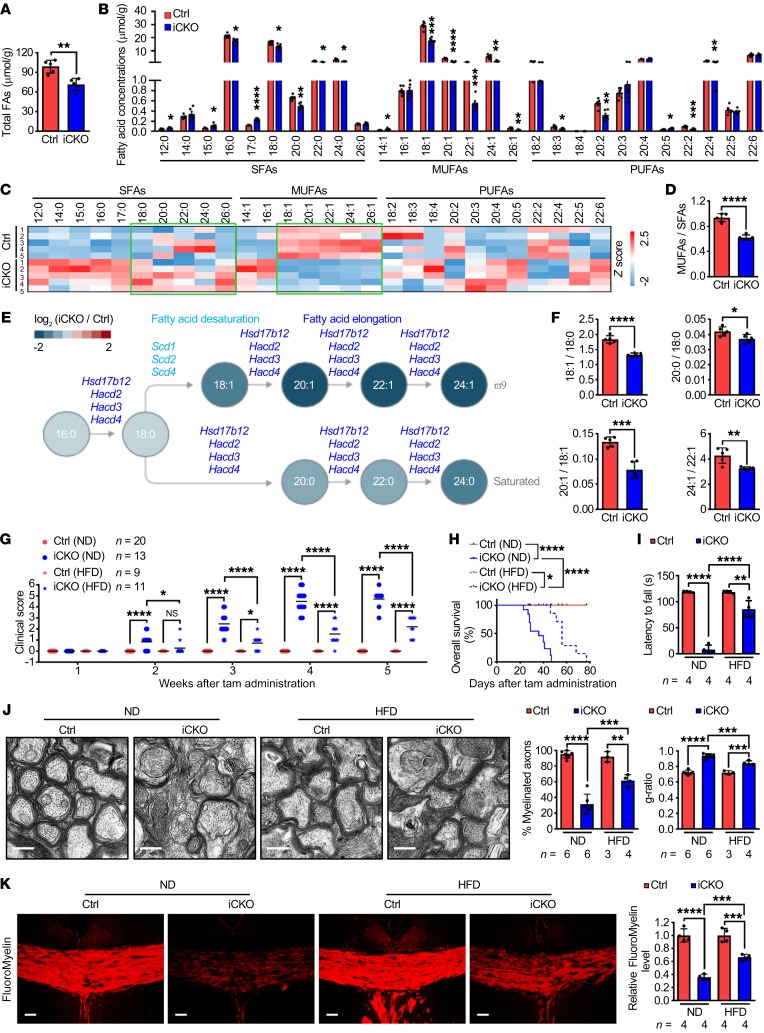
Figure 4. Qki controls fatty acid desaturation and elongation and HFD alleviates Qki deficiency–induced demyelination.
(A and B) Quantification of the concentration of total and each species of fatty acids (FAs) in the spinal cords of Qk-iCKO mice and controls 5 weeks post injection (wpi) (n = 5 mice/group). (C) Heatmap plotting the compositions of each fatty acid species in the samples in A (n = 5 mice/group). The green boxes highlight the saturated and monounsaturated LCFAs and VLCFAs. (D) Quantification of the MUFA/SFA ratios in the samples in A (n = 5 mice/group). (E) Schema showing the desaturating and elongating reactions of fatty acids with the reduction in specific fatty acid molecules (from lipidomic data) and the downregulated corresponding enzymes (from RNA-seq data) in Qk-iCKO mice relative to controls. (F) Quantification of the product/substrate ratios of representative fatty acid desaturating and elongating reactions in the samples in A (n = 5 mice/group). (G and H) The clinical scores (G) and Kaplan-Meier overall survival curves (log-rank test; H) of Qk-iCKO mice and controls fed a normal diet (ND) or HFD. The experimental mouse number is indicated in G. (I) Latency to fall (in seconds) off the rotarod (5 rpm) for Qk-iCKO mice and controls fed an ND or HFD for 5 wpi. (J) Representative electron micrographs and quantification of the percentage of myelinated axons and g-ratio of the optic nerves of Qk-iCKO mice and controls fed an ND or HFD for 5 wpi. Scale bars: 500 nm. (K) Representative images and quantification of FluoroMyelin level in the corpus callosum of Qk-iCKO mice and controls fed an ND or HFD for 5 wpi. Scale bars: 50 μm. Data are mean ± SD. *P < 0.05; **P < 0.01; ***P < 0.001; ****P < 0.0001 by Student’s t test (A, B, D, and F) or 1-way ANOVA followed by Bonferroni’s post hoc test (G and I–K). NS, not significant.

