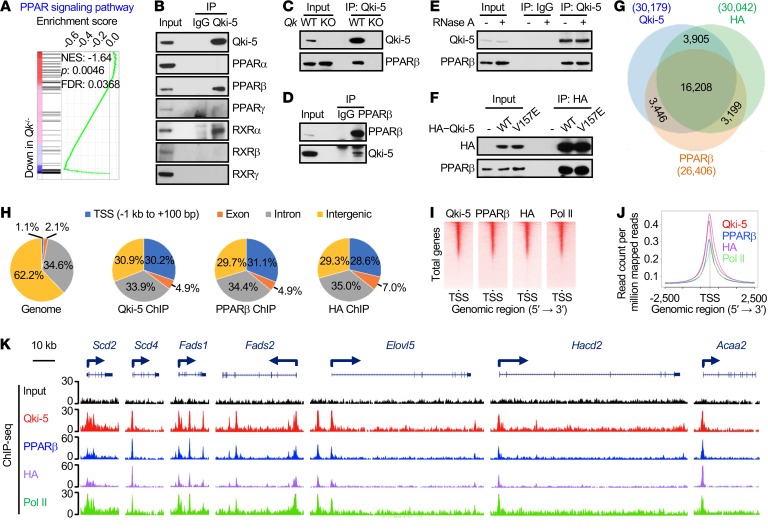
Figure 5. Qki-5 interacts with PPARβ-RXRα to regulate the transcription of genes involved in fatty acid metabolism.
(A) GSEA shows the PPAR signaling pathway signature in freshly isolated mouse oligodendrocytes. (B) Co-IP using an anti–Qki-5 antibody in differentiated oligodendrocytes, followed by the detection of homologs of PPAR and RXR via immunoblotting. (C) Co-IP using an anti–Qki-5 antibody in differentiated oligodendrocytes, followed by detection of PPARβ via immunoblotting. Qk-knockout (Qk-KO) cells served as a negative control to exclude nonspecific immunoprecipitation from the anti–Qki-5 antibody. (D) Reciprocal co-IP using an anti-PPARβ antibody, blotted with an anti–Qki-5 antibody. An IgG antibody served as a negative control. (E) Co-IP of Qki-5 and PPARβ in differentiated oligodendrocytes that were treated with RNase A while alive. (F) Co-IP of HA–Qki-5 (WT or V157E mutant) and PPARβ in differentiated oligodendrocytes. (G) Overlap of ChIP-seq peak sets of Qki-5, PPARβ, and HA in differentiated oligodendrocytes with ectopic expression of HA-PPARβ. (H) Genomic global distribution of the ChIP-seq peaks of Qki-5, PPARβ, and HA. (I) ChIP-seq density heatmaps of Qki-5, PPARβ, HA, and Pol II within ± 1 kb of the transcription start site (TSS). All peaks are rank ordered from high to low Qki-5 occupancy. (J) Average genome-wide occupancies of Qki-5, PPARβ, HA, and Pol II within ± 2.5 kb of the TSS. (K) Representative ChIP-seq binding peaks of Qki-5, PPARβ, HA, and Pol II on gene loci associated with fatty acid metabolism. Data are representative of 3 independent experiments (B–F).

