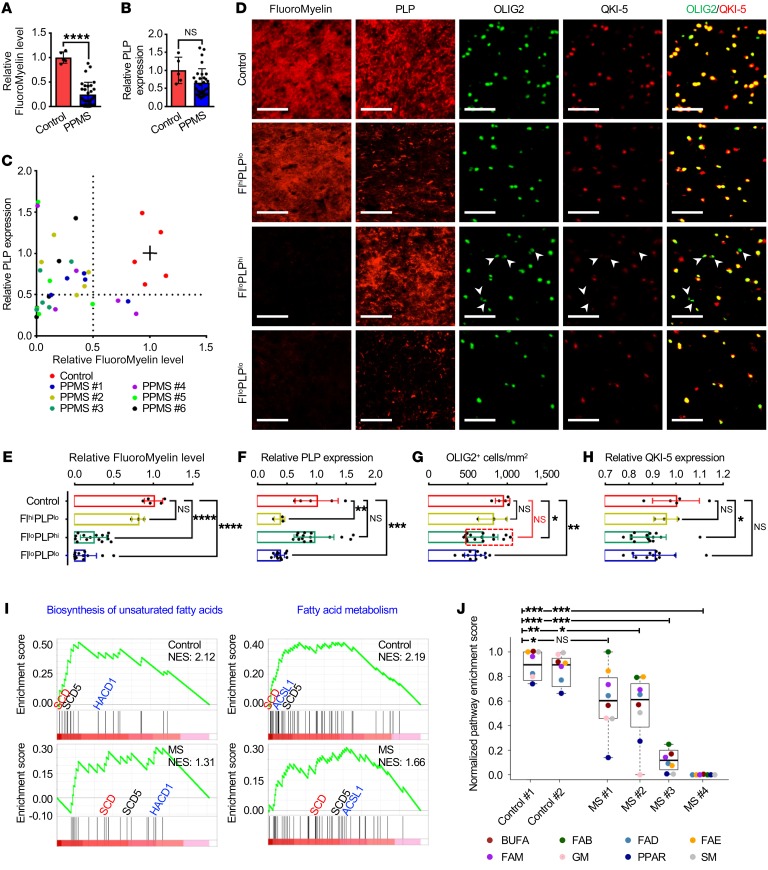
Figure 7. Lipids are more vulnerable than proteins in PPMS lesions.
(A and B) Quantification of staining of FluoroMyelin (A) and PLP (B) in the frontal lobes from 5 human brains without neurological disease (control) and 30 lesions from 6 patients with PPMS. (C) Scatter plot of FluoroMyelin intensity versus PLP intensity in the samples in A. The solid lines among red dots represent the average levels of FluoroMyelin and PLP in controls. (D–H) Representative images (D) and quantification of FluoroMyelin level (E), PLP level (F), OLIG2+ cell number (G), and QKI-5 level (H) in controls and 3 subtypes of PPMS lesions, which were divided according to the level of FluoroMyelin and PLP in C. n = 5 in the control group; n = 3 in the FlhiPLPlo group; n = 15 in the FlloPLPhi group; n = 12 in the FlloPLPlo group. Scale bars: 50 μm. (I and J) Comparison of GSEA of fatty acid metabolism pathways (I) and the NES (J) between MS lesions and the controls. Box plots indicate medians, interquartile values, ranges, and individual pathways. BUFA, biosynthesis of unsaturated fatty acids; FAB, fatty acid biosynthesis; FAD, fatty acid degradation; FAE, fatty acid elongation; FAM, fatty acid metabolism; GM, glycerophospholipid metabolism; SM, sphingolipid metabolism. Data are mean ± SD. *P < 0.05; **P < 0.01; ***P < 0.001; ****P < 0.0001 by Student’s t test (A and B), 1-way ANOVA followed by Bonferroni’s post hoc test (E–H), or Wilcoxon’s signed-rank test (J). NS, not significant.

