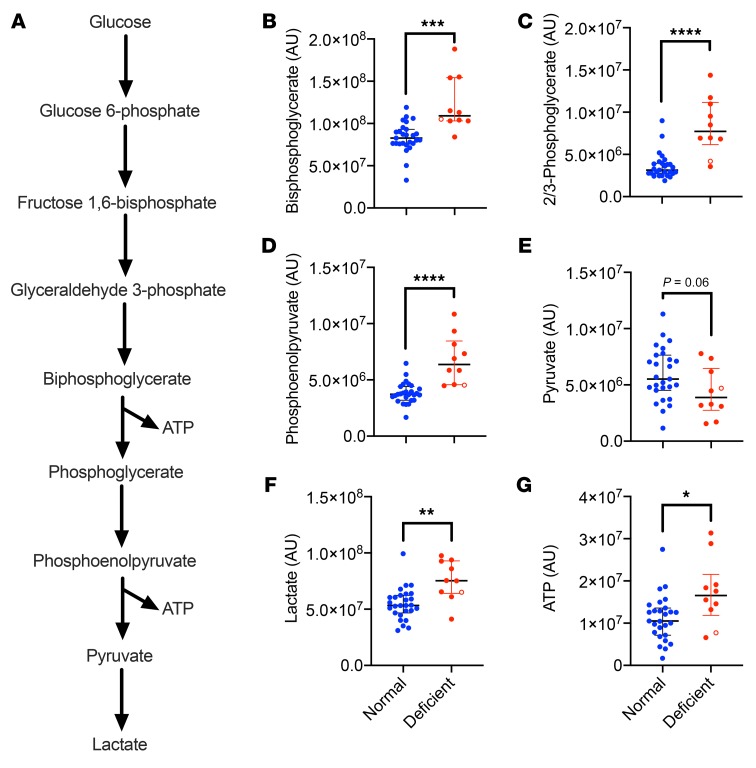
Figure 4. Differences in glycolysis between G6PD-deficient and G6PD-normal RBCs at baseline.
(A) Schematic of the glycolytic pathway. The levels of glycolytic intermediates were measured in RBCs collected directly from volunteers and measured before storage. (B) bisphosphoglycerate, (C) 2/3 phosphoglycerate, (D) phosphoenolpyruvate, (E) pyruvate, (F) lactate, and (G) ATP in G6PD-normal (blue; n = 27) and G6PD-deficient (red; n = 10) RBCs are shown. Median with interquartile range represented. Unfilled red circles represent the single subject with the Mediterranean variant. Statistical significance was assessed by the Mann Whitney U test; *P < 0.05, **P < 0.01, ***P < 0.001, ****P < 0.0001.

