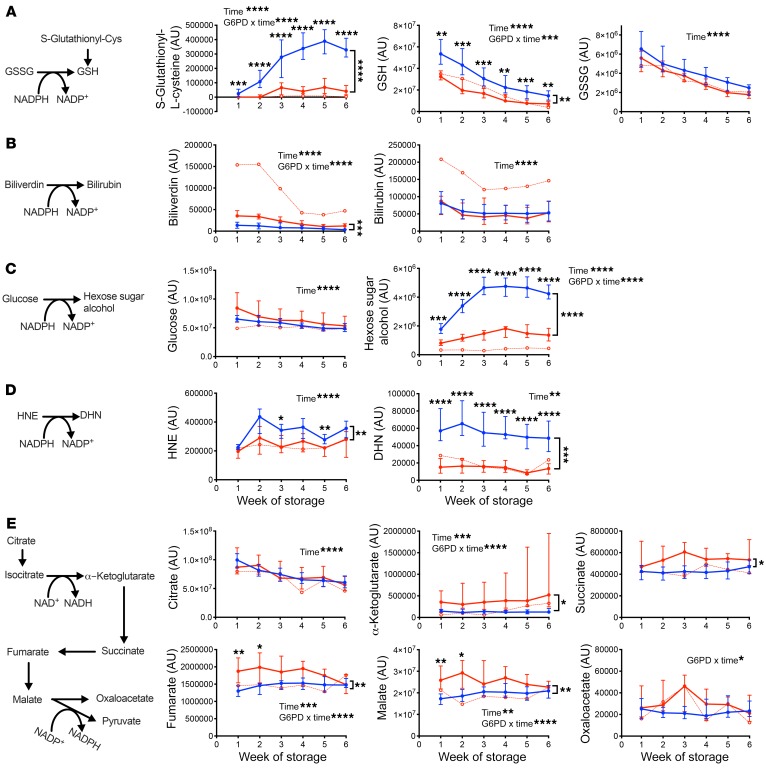
Figure 7. NADPH-dependent/generating metabolic pathways affected by G6PD deficiency in stored RBCs.
Metabolite levels were measured in RBCs during weeks 1 to 6 of refrigerated storage. Schematic of the NADPH-dependent/generating pathway shown with graphs of relevant metabolites throughout storage to the right in each figure panel. (A) Reduction of oxidized glutathione (GSSG) to reduced glutathione (GSH) and glutathionylation of cysteine residues (S-glutathionyl-Cys), (B) conversion of biliverdin to bilirubin, (C) conversion of glucose to hexose sugar alcohol, (D) conversion of 4-hydroxynonenal (HNE) to dihydroxynonene (DHN), and (E) conversion of malate to pyruvate. Medians with interquartile ranges are shown. G6PD-normal (blue; n = 27) and G6PD-deficient (red; n = 10) are represented. The dotted red lines with the unfilled circles represent the single subject with the Mediterranean variant. Statistical significance was calculated using 2-way repeated-measures ANOVA with Sidak’s multiple comparisons test; *P < 0.05, **P < 0.01, ***P < 0.001, ****P < 0.0001. Significance for the effect of storage time and the interaction between G6PD status and time are as labeled, or not significant if not shown. Significant time points are shown and significant differences between G6PD-deficient and G6PD-normal subjects are denoted with a bracket to the right of the curves. When the interaction term was significant, the significance of the main effects was assessed in MetaboAnalyst.

