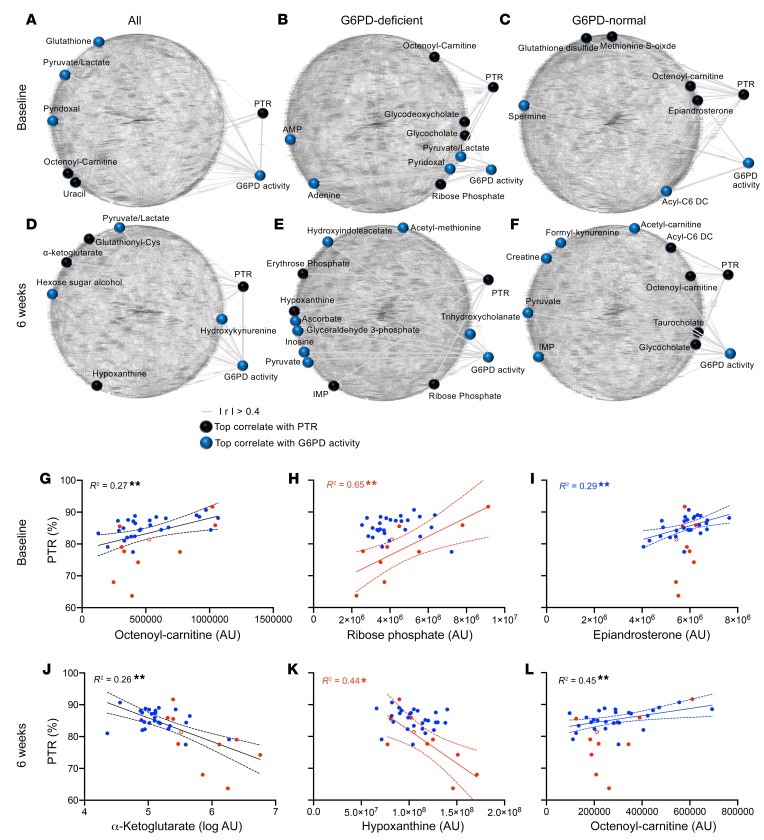
Figure 9. Metabolic alterations at baseline and end of storage in G6PD-deficient RBCs correlate with G6PD activity and PTR.
Circos plots of metabolic correlates to PTR and G6PD activity in the total population of subjects at baseline (A) or after 6 weeks of storage (D), in only G6PD-deficient subjects at baseline (B) or week 6 (E), or only G6PD-normal subjects at baseline (C) or week 6 (F). Metabolites are represented as nodes and connected by an edge if their linear correlation (Spearman) is higher than 0.4. Highlighted nodes represent the most significant correlates (Spearman, FDR adjusted P values < 0.05) with PTR (black spheres) or G6PD activity (blue spheres). The correlation of baseline levels of octenoyl-carnitine (G), ribose phosphate (H), and epiandrosterone (I); and week 6 levels of α-ketoglutarate (J), hypoxanthine (K), and octenoyl-carnitine (L) in the total subject population, or limited to only G6PD-deficient or G6PD-normal subjects, respectively. *P < 0.05, **P < 0.01. G6PD-normal (blue; n = 27) and G6PD-deficient (red; n = 10) subjects are represented. The unfilled red circle represents the single subject with the Mediterranean variant.

