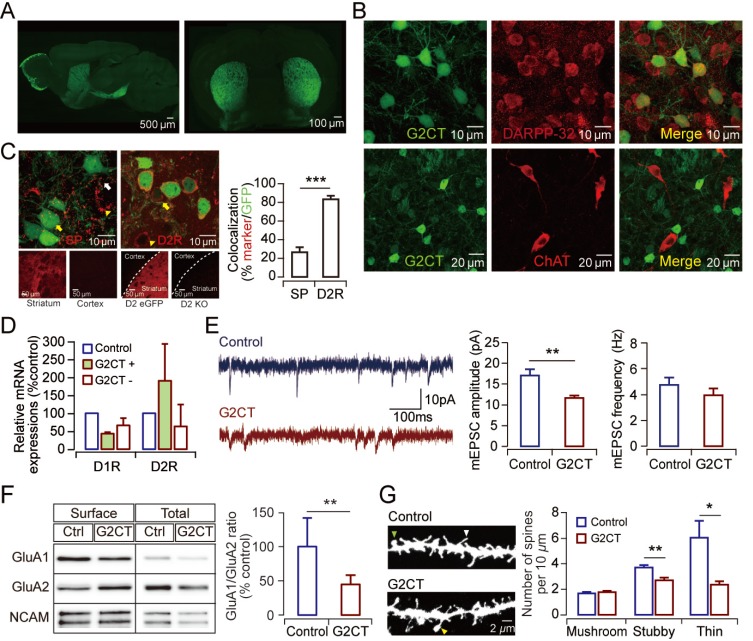
Fig. 1. Synaptic weakening of MSNs in the G2CT transgenic mice is accompanied by biochemical and structural changes at synapses.
(A) Expression of the G2CT peptide is shown in the sagittal (left) and coronal (left) sections from G2CT transgenic mouse. (B) Representative images of double immunostaining displaying G2CT-positive cells (green) with DARPP-32 (top, red) or choline acetyltransferase (ChAT; bottom, red). (C) Representative images of double immunostaining displaying G2CT-expressing MSNs (green) with substance P (SP; red, left), or D2R (red, middle) in the dorsal striatum of G2CT mice (yellow arrows, G2CT+SP+ or G2CT+D2R+ cells; white arrow, G2CT+SP- or G2CT+ENK- cells; yellow arrowheads, G2CT-SP+ or G2CT-ENK+ cells). Negative control images showing SP immunostaining in the cortex and D2R immunostaining in the striatum of D2R knockout mouse (D2-KO) are shown below with positive staining images for comparison. The quantified results are shown in a graph on the right (SP, n = 8 slices from three G2CT mice; D2R, n = 15 slices from four G2CT mice). (D) Quantitative gene expression analysis from the FACS-sorted MSNs of the G2CT mice. The graph is plotted as the relative expression levels normalized to the expression level in control mice (control, n = 3 mice; G2CT, n = 3 mice). (E) Representative mEPSC traces from the control mice (top) and the G2CT mice (bottom) are shown on the left. Quantified results of the average peak amplitude (middle) and the frequency (right) of the mEPSCs are shown in the graphs (control, n = 8 cells; G2CT, n = 9 cells). (F) Surface biotinylation assays. Representative immunoblot images (left) and quantified results (right) are shown (control, n = 10 mice; G2CT, n = 10 mice). (G) Dendritic spine analysis in the MSNs. Representative images of dendritic spines (left) and the results of quantitative morphological analysis of the dendritic spines of striatal MSNs (right) are shown (control, n = 16 cells; G2CT, n = 18 cells). In all graphs, blue bars represent control mice and red bars represent G2CT mice. *P < 0.05, **P < 0.01, ***P < 0.001.

