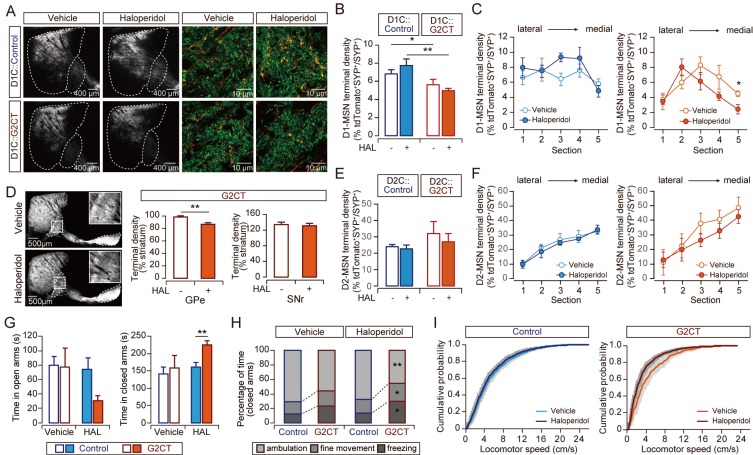
Fig. 3. Amount of bridging collaterals is correlated with stress-related behavior.
(A) Representative images of the collateral terminals of D1-MSNs within the GPe. Mice (D1C::Control or D1C::G2CT) were injected with AAV-DIO-tdTomato to visualize D1-MSNs. Sagittal sections showing overall distribution of D1-MSNs and their axons are shown on the left (the striatum and the GPe areas are marked by white dashed lines). Higher magnification images showing the axons of D1-MSNs (red) and synaptophysin (SYP, green) immunostaining are shown on the right. We quantified the overlapping yellow puncta (tdTomato+SYP+) as the collateral terminals. (B) Quantification of the collateral terminals of the D1-MSNs within the GPe (D1C::Controlvehicle n = 3 mice; D1C::G2CTvehicle, n = 5 mice; D1C::Controlhaloperidol, n = 4 mice; D1C::G2CThaloperidol, n = 4 mice; five sections/mouse). (C) Lateral to medial distribution of the D1-MSN collateral terminal density in the GPe of D1C::Control (left) or D1C::G2CT (right). (D) Representative images of the sagittal sections from G2CT mice (vehicle- or haloperidol-injected) are shown (left). Insets are showing magnified images of the GPe. The results of the quantitative analysis for the fluorescence intensity in the GPe and SNr are shown in a graph (right). Fluorescence intensity of the whole striatum from each section was used for normalization (G2CTVehicle, 24 slices from n = 6 mice; G2CT Haloperidol, 32 slices from n = 8 mice). (E) Quantification of the terminals of the D2-MSNs within the GPe of AAV-DIO-tdTomato-injected D2C::Control or D2C::G2CT mice (D2C::Controlvehicle n = 5 mice; D2C::G2CTvehicle, n = 5 mice; D2C::Controlhaloperidol, n = 7 mice; D2C::G2CThaloperidol, n = 5 mice; 5 sections/mouse). (F) Lateral to medial distribution of the D2-MSN terminal density in the GPe of AAV-DIO-tdTomato-injected D2C::Control mice (left) or D2C::G2CT (right). (G-I) Behavioral analysis of haloperidol-injected mice in the EPM test (ControlVehicle, n = 9, Control Haloperidol, n = 9, G2CTVehicle, n = 6, G2CT Haloperidol, n = 8; all groups were exposed to PRST in this experiment). Time spent in the open arms (left) and closed arms (right) (G), movement analysis in the closed arms (H), cumulative probability plot of the locomotor speed in the closed arms (I) are shown. In all graphs, blue represents control mice, and red represents G2CT mice. Data collected from vehicle-injected mice are shown in open bars or circles, and data from haloperidol-injected mice are shown in filled bars or circles. In Fig. 3I, lighter colors indicate vehicle-injected mice and darker colors indicate haloperidol-injected mice. *P < 0.05, **P < 0.01.

