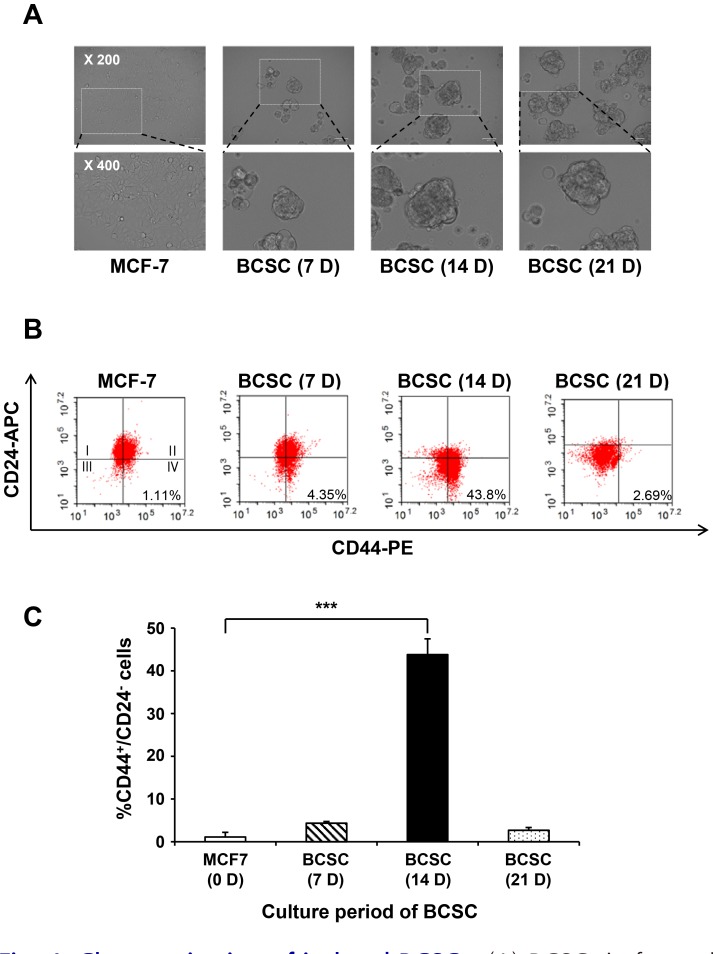
Fig. 4. Characterization of isolated BCSCs.
(A) BCSCs in formed mammospheres were observed using an optical microscope on days 7, 14, and 21. The size of the cells increased in a time-dependent manner. (B) Flow cytometric analysis of cells for CD24–/CD44+. To identify the characteristics of BCSCs, the cell population expressing CD44+ and CD24– were analyzed by flow cytometry. After 3 weeks, the highest level of CD24–/CD44+ CSC marker expression was observed after 14 days. (C) Quantitative data of BCSCs expressing CD24–/CD44+ in a time-dependent manner. Data are expressed as the mean ± SEM. ***P < 0.01.

