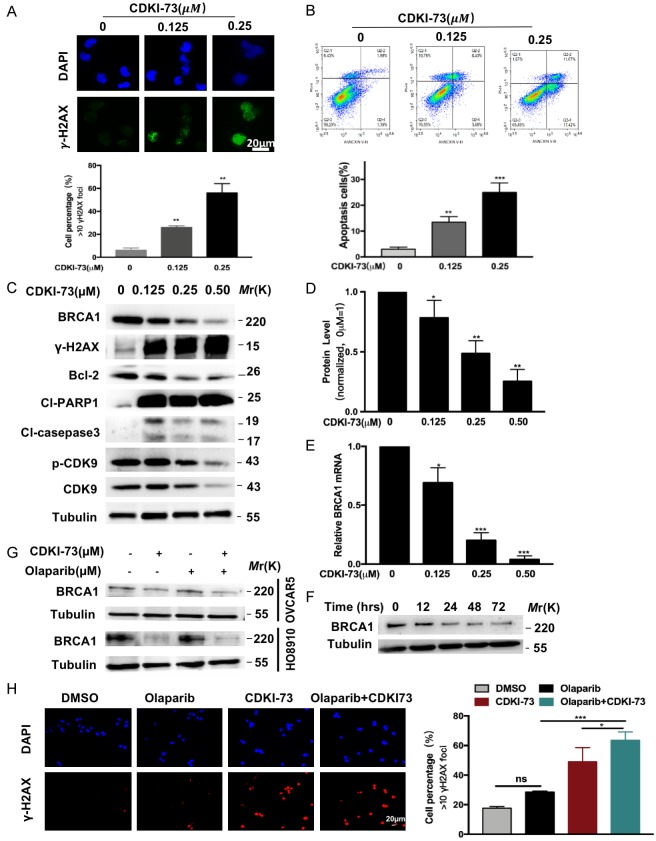
Figure 6.
CDKI-73 downregulates BRCA1. A. Representative immunofluorescence images of γ-H2AX staining in HO8910 cells treated with CDKI-73 at various concentrations (0, 0.125, and 0.25 μM) for 48 hours. DMSO was used as a vehicle. Scale bar, 20 μm. The percentage of γ-H2AX-positive cells (> 10 foci per nucleus) in HO8910 cells treated as described above. B. The percentage of apoptotic cells in HO8910 cells treated as described above was measured by flow cytometry. C. The expression of BRCA1, p-CDK9, CDK9, Bcl-2 proteins, γ-H2AX, cleaved PARP, and cleaved caspase-3 in HO8910 cells treated with CDKI-73. D. The expression of BRCA1 protein in the above cells. Values are shown as the mean ± S.D. and are representative of three independent experiments. *P < 0.05; **P < 0.01 (Student’s t-test). E. Downregulation of BRCA1 mRNA expression in HO8910 cells treated with CDKI-73 at various concentrations (0, 0.125, 0.25, and 0.50 μM) for 48 hours. Values are shown as the mean ± S.D. and are representative of three independent experiments. *P < 0.05; ***P < 0.001 (Student’s t-test). F. Time-dependent reduction in the expression of BRCA1 in HO8910 cells after treatment with 0.25 μM CDKI-73. G. Western blot analysis of BRCA1 in the two ovarian cancer cell lines treated with vehicle control (DMSO), CDKI-73 (0.25 μM), olaparib (0.5 μM) or the combination of the two drugs. Tubulin was used as a loading control. H. (Left) Representative immunofluorescence images of γ-H2AX staining in ovarian cancer cells treated with vehicle control (DMSO), CDKI-73 (0.25 μM), olaparib (0.5 μM), or the combination treatment. Scale bar, 20 μm. (Right) The percentage of positive cells (> 10 foci per nucleus) with γH2AX foci relative to the vehicle control. All data are shown as the mean ± S.D. representative of three independent experiments. *P < 0.05; ***P < 0.001 (Student’s t-test).

