
Figure 1.
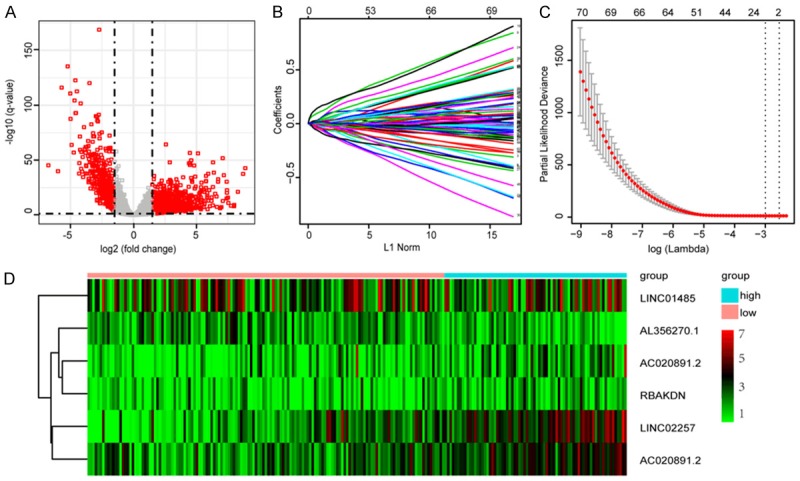
Identification of prognostic lncRNAs. (A) Volcano plots showing expression profiles of lncRNAs. The vertical lines correspond to 2.0-fold up- and down-regulation between CRC tissues and adjacent nontumorous tissues, and the horizontal line represents a q-value. The red point in the plot represents the differentially expressed miRNAs or mRNA with statistical significance; (B) Cross-validation for tuning parameter selection in the LASSO model; (C) LASSO coefficient profiles of 70 lncRNAs; and (D) Heat map of six lncRNAs in training set.