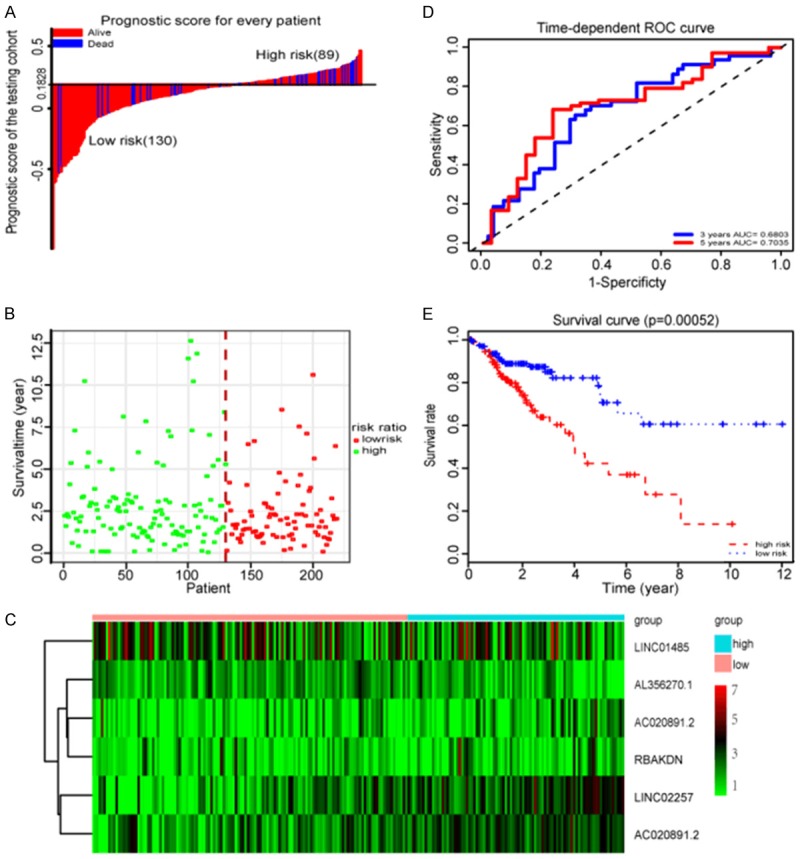
Figure 3.

Properties of the testing set prognostic classifier. A. The distribution of risk score of testing cohort. B. Testing cohort survival time and status. C. Heat map of six lncRNAs in testing set. D. Time-dependent ROC curves analysis in the testing set. E. Kaplan-Meier survival analysis in the testing set.
