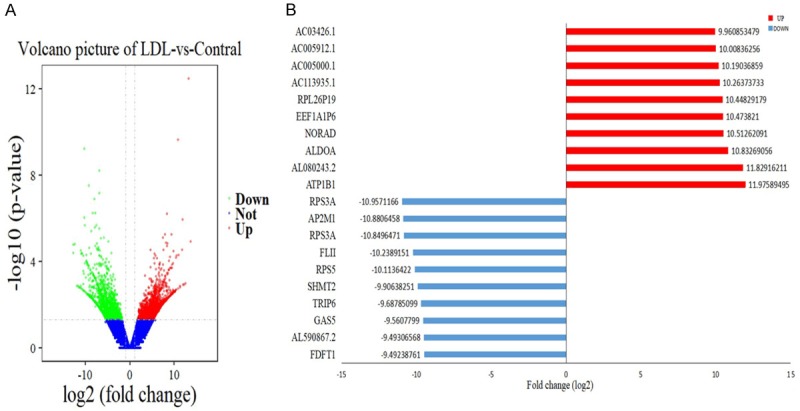
Figure 3.

Differential expression of data between two sets of samples. A. Volcano map. Red points represent up-regulated transcripts screened on the basis of absolute fold change ≥ 2.0 and a corrected P value of < 0.05. Green points represent the expression of transcripts that were down-regulated, screened on the basis of absolute fold change ≥ 2.0 and a corrected P value of < 0.05. The black points represent transcripts with no significant change. B. The most substantially (P < 0.05) up-regulated and down-regulated transcripts based on oxLDL treatment of HLEpiC (n = 3).
