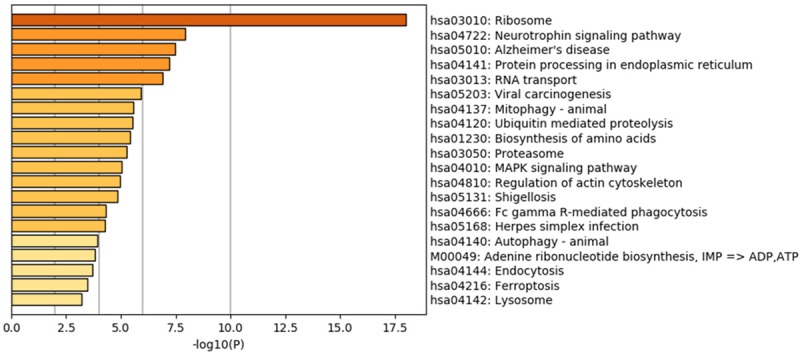
Figure 5.

KEGG enrichment results. Scatterplot of the top 20 KEGG enrichment results of differentially expressed transcripts in each pairwise comparison that were annotated in the specific pathway term. A high RichFator represents greater intensiveness. A lower P value represents greater intensity.
