
Figure 7.
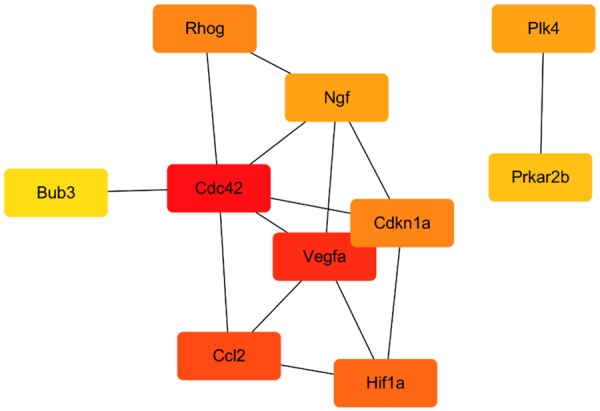
Top 10 hub genes. Red indicates genes with high scores. Yellow and orange indicate genes with middle scores, increasing respectively.
Official websites use .gov
A
.gov website belongs to an official
government organization in the United States.
Secure .gov websites use HTTPS
A lock (
) or https:// means you've safely
connected to the .gov website. Share sensitive
information only on official, secure websites.
Top 10 hub genes. Red indicates genes with high scores. Yellow and orange indicate genes with middle scores, increasing respectively.