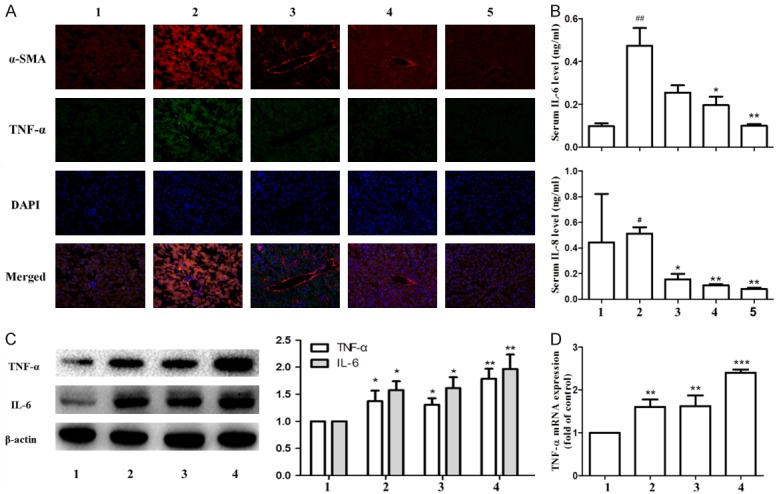
Figure 3.

Effects of ligustrazine or/and Paeonol on liver fibrosis indices and inflammation indices. A. α-SMA and TNF-α in livers was visualized by immunofluorescence staining. Each panel represents a separate experiment. B. Determination of IL-6 and IL-8 in serum. A, B. 1: control group, 2: model group, 3: ligustrazine group (100 mg/kg), 4: paeonol group (100 mg/kg), 5: combination group (combined therapy with ligustrazine 100 mg/kg and paeonol 100 mg/kg). C. Western blot analyses of protein expression of TNF-α and IL-6. D. RT-PCR analyses of gene expression of TNF-α. C, D. 1: model group, 2: ligustrazine group (20 μM/L), 3: paeonol group (25 μM/L), 4: combined intervention group (Combined intervention with ligustrazine 20 μM/L and paeonol 25 μM/L). #, P<0.05 and ##, P<0.01 vs. control group. *, P<0.05, **, P<0.01 and ***, P<0.001 vs. model group.
