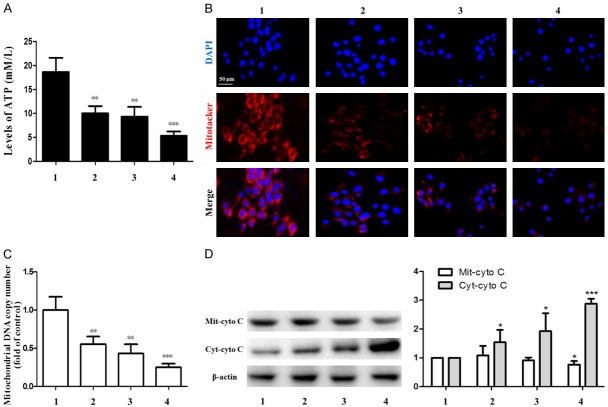
Figure 6.
Effects of ligustrazine or/and Paeonol on mitochondria in HSC. A. ATP content in HSC mitochondria was determined by ATP detection kit. B. Illustrating the Immunofluorescence microscopic finding the number of mitochondria in each group. Blue color indicates nuclei stained by DAPI. Red color indicates mitotracker-positively stained cells. C. Mitochondrial DNA copy number was tested. D. Western blot analyses of protein expression of Mit-cyto C and enhances protein expression of Cyt-cyto C. 1: model group, 2: ligustrazine group (20 μM/L), 3: paeonol group (25 μM/L), 4: combined intervention group (Combined intervention with ligustrazine 20 μM/L and paeonol 25 μM/L). *, P<0.05, **, P<0.01 and ***, P<0.001 vs. model group.

