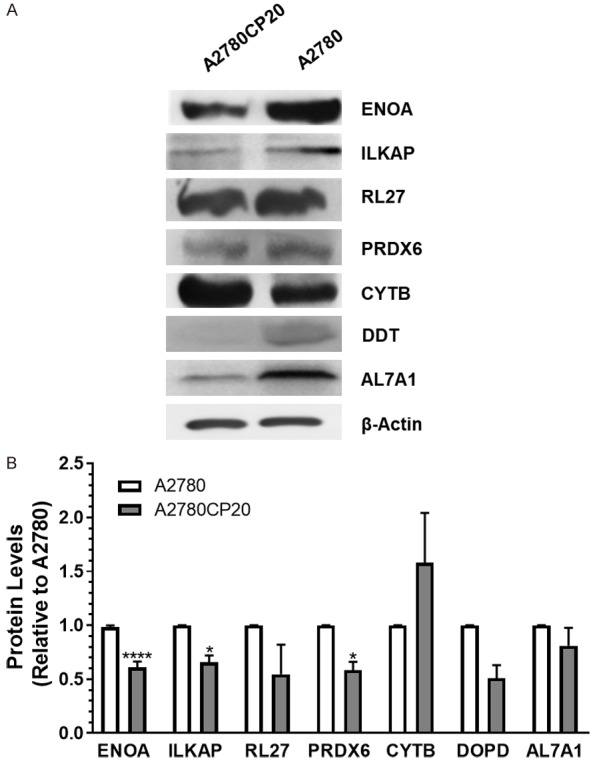
Figure 1.

Western blot validation of the proteomic results. (A) Western blot analysis was performed using 30-50 µg of protein extracts. Beta-Actin (β-actin) was used as a loading control. (B) Densitometry analysis of band intensities shown in (A). Fold changes in protein levels were calculated relative to A2780 cells. Averages ± SEM are shown for three independent experiments. *P<0.05, ****P<0.0001.
