
Figure 6.
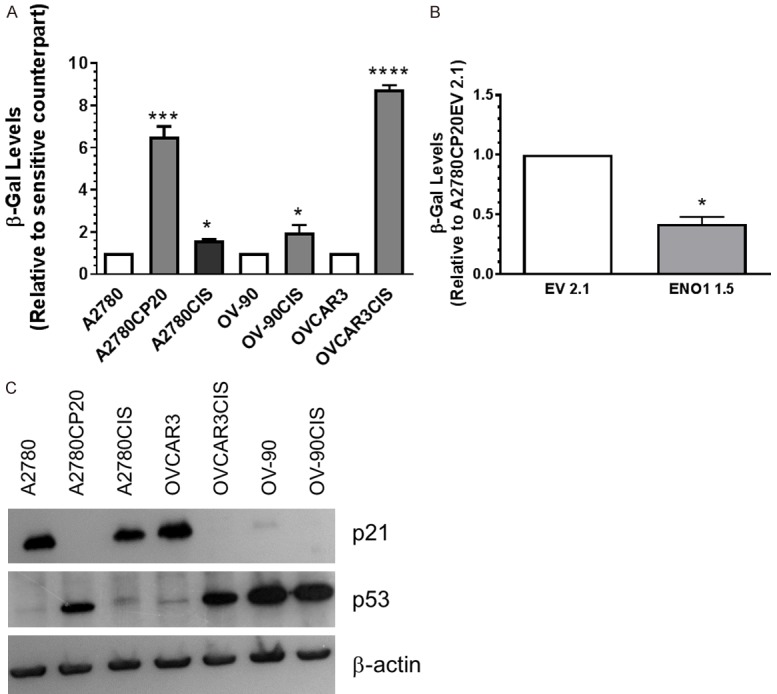
Senescence-associated β-galactosidase and senescence-associated markers. Cells (1 × 10⁴ cells/ml) were plated in 6-well plates. Twenty-four hours later, cells were rinsed with PBS, and protein extracts were prepared and diluted at a 1 µg/mL protein concentration. Senescence-associated β-galactosidase activity (SA-β-gal) was assessed by fluorescence. β-galactosidase levels were calculated relative to each cisplatin-sensitive cell pair (A) or relative to the EV clone (B). Averages ± SEM are shown for three independent experiments. *P<0.05, ***P<0.001, ****P<0.0001. (C) Western blot analysis was performed using 50 µg of protein extracts.