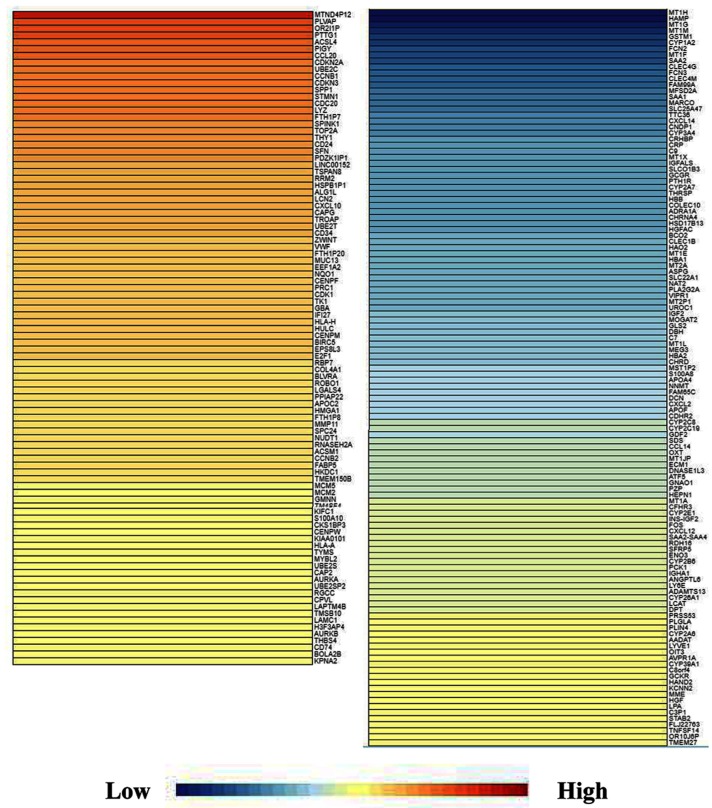
Figure 1.
DEGs identification. GEPIA, as a new and powerful web-based tool, was applied because it is a visualization website based on the TCGA database. The DEGs analysis in HCC was conducted with a criteria of P < 0.05 and |log2FC| > 2 and then GEPIA was searched to retrieve data on the DEGs. A map of the 262 overlapping DEGs was obtained. DEGs were further validated using NetworkAnalyst and visualized using Cytoscape software. As shown in Table 1, the collected genes included 117 upregulated DEGs and 145 downregulated DEG. DEGs, differentially expressed genes. HCC, hepatocellular carcinoma; FC, fold change; GEPIA, Gene Expression Profiling Interactive Analysis; TCGA, The Cancer Genome Atlas.

