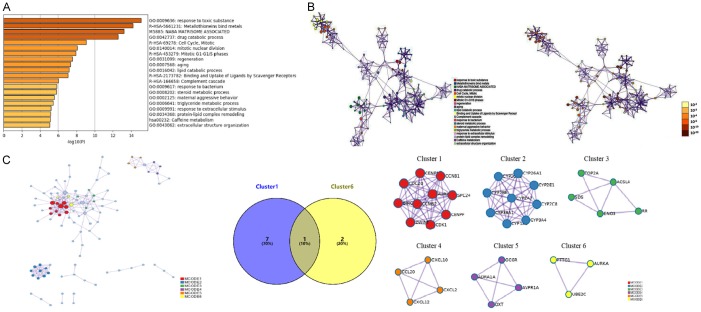
Figure 2.
Enrichment analysis and PPI network construction. A, B. A network of GO and KEGG enriched terms colored by P-values was generated. The retrieved data correspond with Table 2. The 13 most enriched GO terms of the DEGs were obtained in patients with HCC (P < 0.001), as follows: response to toxic substance, drug catabolic process, mitotic nuclear division, regeneration, aging, lipid catabolic process, response to bacteria, steroid metabolic process, maternal aggressive behavior, triglyceride metabolic process, response to extracellular stimulus, protein-lipid complex remodeling, and extracellular structure organization. KEGG pathway analysis showed significant signaling pathways associated with DEGs in HCC pursuant to P-value, as presented in Table 3. C. Based on the frequency of module genes in enrichment analyses and the number of enrichment genes in each cluster as shown in Table 4, cluster one and cluster six were screened for analysis. According to the union set of important eight genes in cluster one and three genes in cluster six, CCNB1, CDC20, CCNB2, CDK1, SPC24, CENPW, ZWINT, PTTG1, AURKA, and UBE2C were selected. GO, Gene ontology; KEGG, Kyoto Encyclopedia of Genes and Genomes. MCODE, Molecular Complex Detection; HCC, hepatocellular carcinoma.

