
Fig. 2.
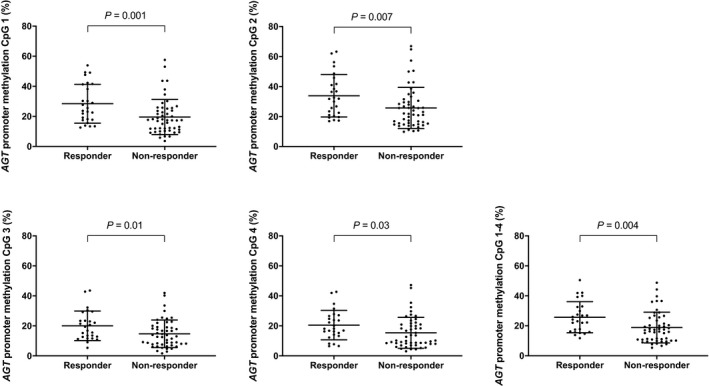
DNA methylation levels of the four analyzed CpG sites as well as the mean level of CpG sites 1–4 in the AGT promoter in responding and nonresponding patients of the training cohort. Mean values and standard deviations are shown by horizontal lines.