
Fig. 7.
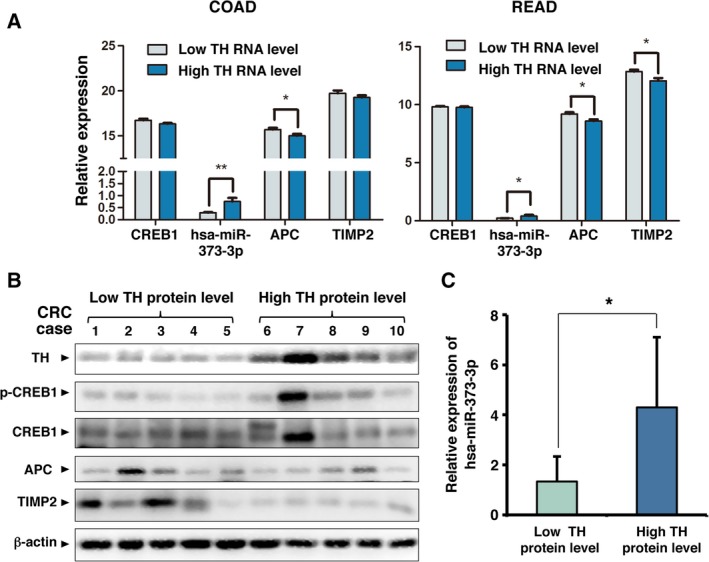
Analysis of TH, CREB1, hsa‐miR‐373‐3p, APC, and TIMP2 expression in human CRC using TCGA database and clinical CRC samples. (A) Data on TH, CREB1, hsa‐miR‐373‐3p, APC, and TIMP2 expression in CRC tumor tissues were extracted from the RNAseq Illumina HiSeq dataset in TCGA database. There were 23 cases of TCGA colon cancer (COAD) and 14 cases of TCGA rectal cancer (READ) with simultaneous data on TH, CREB1, hsa‐miR‐373‐3p, APC, and TIMP2. The cases were ranked according to the expression level of TH and divided into two groups; the half with lower TH expression was designated the Low TH RNA level group, and the other half was designated the High TH RNA level group. The expression of CREB1, hsa‐miR‐373‐3p, APC, and TIMP2 in these two groups was compared, and P‐values were calculated using unpaired t‐test. (B) Protein lysates were harvested from the tumors of each clinical CRC case. The levels of TH, phospho‐CREB1, CREB1, APC, and TIMP2 were detected by western blotting. β‐actin was used as the loading control. (C) RNA was extracted from the tumors of clinical CRC patients. The levels of hsa‐miR‐373‐3p were measured by qRT‐PCR and compared between the group with Low TH protein level and the group with High TH protein level. Error bars are represented as mean ± SD (n = 12). P‐values were calculated using unpaired t‐test. * represents P < 0.05 and ** represents P < 0.01.