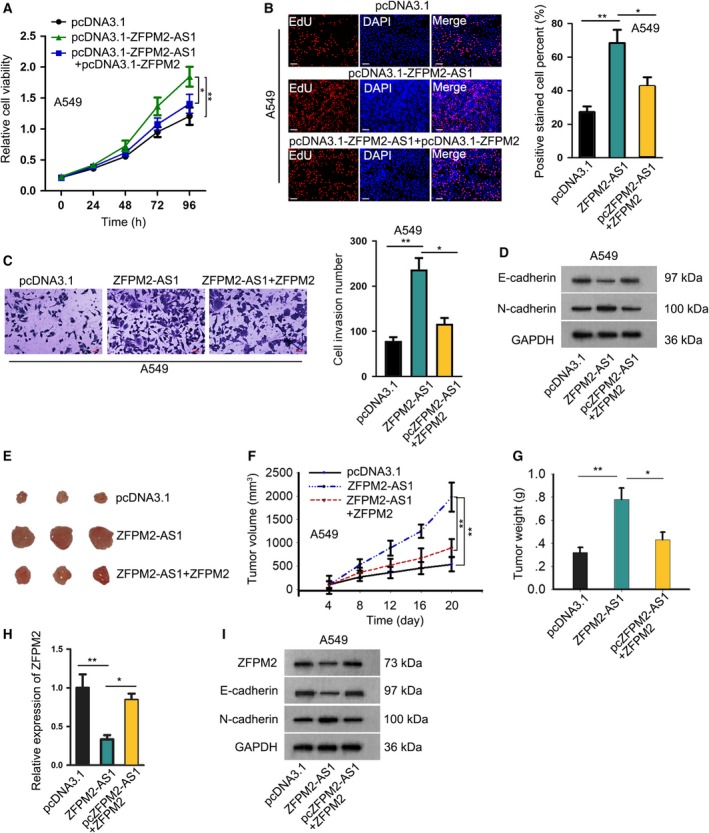
Figure 7.

ZFPM2‐AS1 regulated LUAD progression in vitro and in vivo through UPF1/ZFPM2 axis. A549 cells were transfected with pcDNA3.1, pcDNA3.1/ZFPM2‐AS1, or pcDNA3.1/ZFPM2‐AS1 + ZFPM2, for in vitro and in vivo assays. (A–C) CCK‐8 (mean ± SD; n = 6; two‐way ANOVA), EdU (scale bar = 100 μm; mean ± SD; n = 6; one‐way ANOVA), and Transwell invasion assays (scale bar = 50 μm; mean ± SD; n = 6; one‐way ANOVA) were used to assess cell proliferation and invasion of A549 cells in each group. (D) Western blot analysis was used to evaluate the expressions of E‐cadherin and N‐cadherin in each group. (E) A549 cells with different transfection were injected into nude mice, and the growth of xenografts was evaluated over time. Pictures of xenografts from each group were taken. (F, G) The growth curve (mean ± SD; n = 6; two‐way ANOVA) and final tumor weight of the xenografts (mean ± SD; n = 6; one‐way ANOVA) in each group. (H) ZFPM2 expression from the xenografts in each group was evaluated by RT‐qPCR analysis (mean ± SD; n = 6; one‐way ANOVA). (I) Western blot analysis was used to evaluate the expression of ZFPM2, E‐cadherin, and N‐cadherin from the tumors of mice in each group. *P < 0.05, **P < 0.01.
