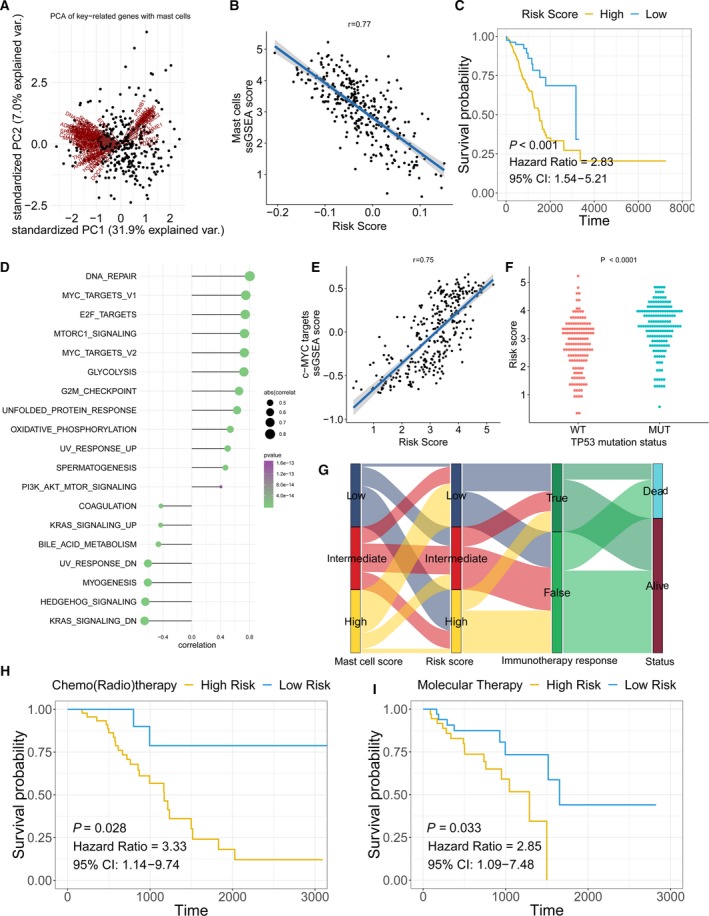
Fig. 5.

Mast cell‐related signature‐based risk score calculation and the potential mechanism underlying the mast cells in early‐stage LUAD. (A) PCA of the key mast cell‐related genes. (B) The correlation between the prognostic signature‐based risk score and the mast cell ssGSEA score in early‐stage LUAD patients. (C) Univariate Cox analysis and Kaplan–Meier curves showed prolonged survival in patients with low‐risk scores compared with patients with high‐risk scores. (D) The correlation between the ssGSEA score of each hallmark gene and the risk score. (E) The correlation between the risk score and ssGSEA score in early‐stage LUAD patients. (F) The risk score distribution in patients with wild‐type or mutated TP53. P‐value was calculated with Mann–Whitney U‐test. (G) A Sankey plot was used to reveal the correlation between mast cell scores, prognostic signature‐based risk scores, immunotherapy response and clinical outcome. (H, I) Patients who received adjuvant therapies, including chemo(radio)therapy and targeted therapy, with low‐risk scores, exhibited prolonged overall survival.
