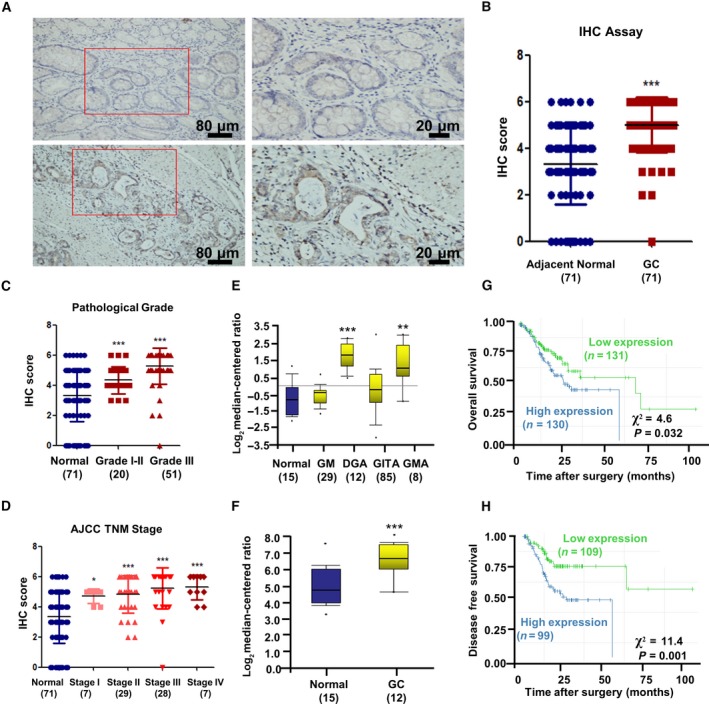
Fig. 1.

Matrix Gla protein expression was upregulated in GC and associated with poor prognosis. (A) GC and adjacent normal tissues were immunochemistry stained by 1 : 50 MGP antibody. GC tissues showed strong‐positive staining, while normal tissues indicated low MGP expression. (B) Analysis of IHC staining scores between 71 paired GC and normal tissues. The bars represent the lower quartile, median, and upper quartile. P value is estimated by Kruskal‐Wallis rank test. (C, D) IHC staining scores of GC at different pathological grades and four different AJCC TNM stages were analyzed and compared between normal and GC tissues. The bars represent the lower quartile, median, and upper quartile. P value is estimated by Kruskal‐Wallis rank test (E, F) MGP expression was different between normal gastric tissues and GC in mRNA level depending on a previously published GC dataset regarding variation in gene expression patterns (http://genome-www.stanford.edu/gastric_cancer2/index.shtml) and a GEO dataset (http://www.ncbi.nlm.nih.gov/geo/query/acc.cgi?acc=GSE19826). The results are presented as log2 median‐centered ratio. P values are estimated by one‐way ANOVA. (G, H) The OS (G) and DFS (H) of GC patients stratified by MGP expression levels. Kaplan–Meier plots and log‐rank tests were used for statistical analysis. *P < 0.05; **P < 0.01; ***P < 0.001.
