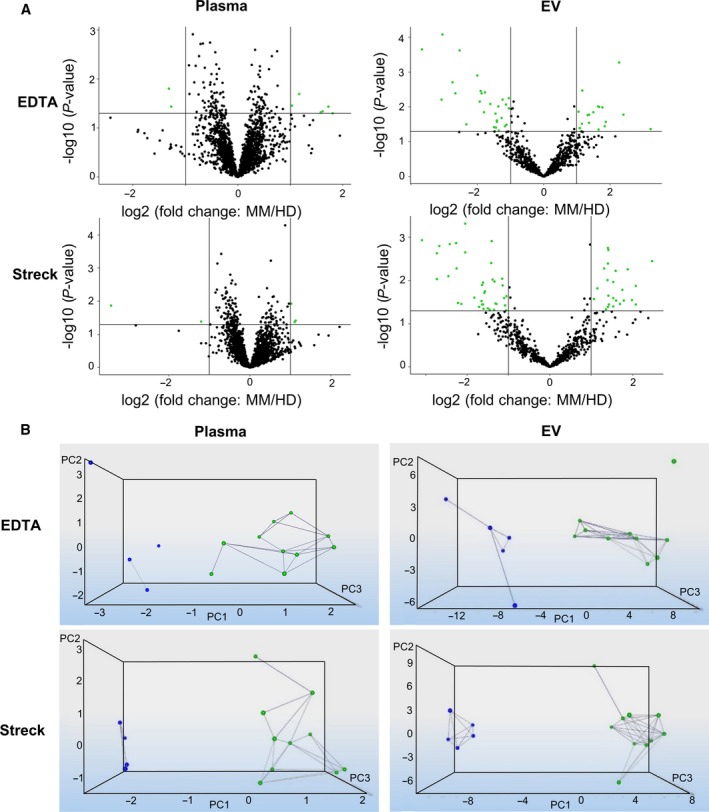
Fig. 4.

Results of significantly differentially regulated miRNA in MM patients compared to HD (A) After normalization with NormFinder and application of FC (> 2) and P‐value (< 0.05) cutoff values, volcano plots illustrate significant differentially expressed genes. Green dots represent statistically significant and differentially regulated miRNA, while miRNA shown as black dots are below these defined thresholds of P‐value and FC. In EDTA plasma and EV samples, eight and 46 miRNA were identified with significantly different expression levels, while in Streck plasma and EV samples five and 62 significant miRNA are shown, respectively. (B) Dynamic PCA results after applying thresholds of FC (> 2) and P‐value (< 0.05). Blue dots represent HDs; MM samples are shown with a green dot. Since both groups are spatially isolated, a good separation of HDs and MM patients is achieved in both EDTA and Streck samples.
