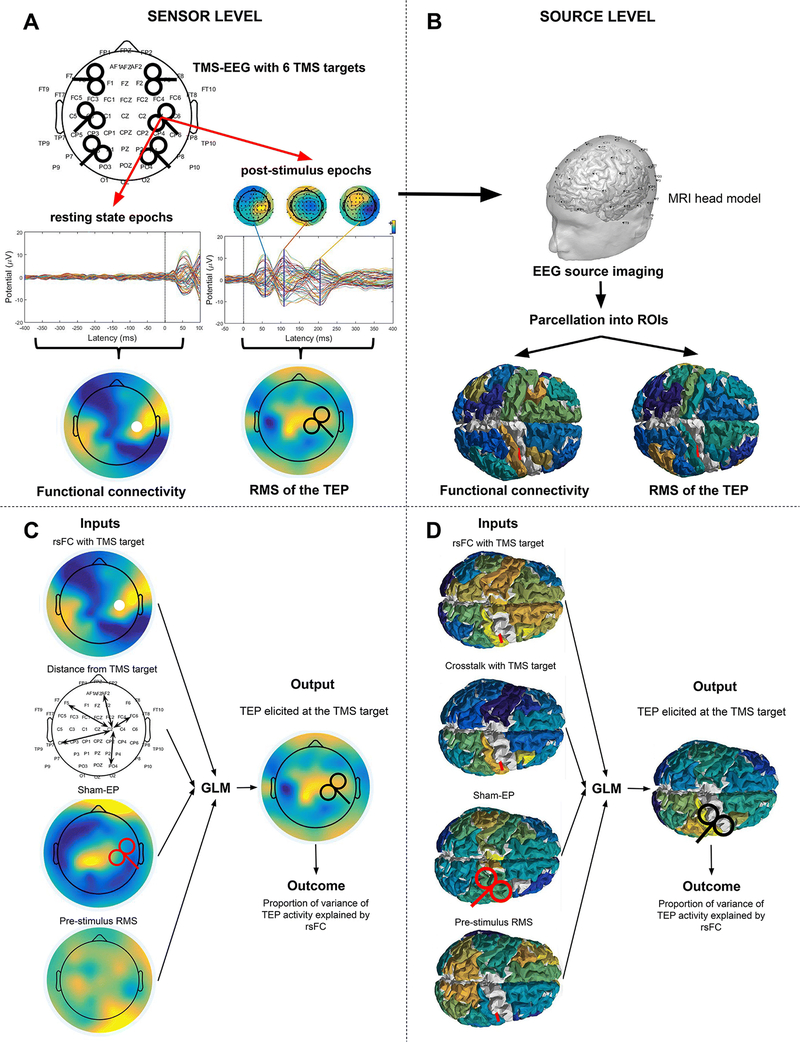
Figure 1.
Schematic overview of the analysis. A. TMS targets during the TMS-EEG acquisition. The DLPFC, M1 and parietal cortices of both hemispheres were stimulated. Pre-stimulus and post-stimulus epochs were obtained from the data for resting state functional connectivity analyses and TEP analysis, respectively. B. EEG source imaging was used for analysis in source space. C. Inputs and output of the GLM analysis: FC map with the TMS target as the seed region; the distance between the TMS target and the other channels; the sham-EP and the pre-stimulus RMS; An evoked activity map. The white circle illustrates the TMS target (RM1), the red TMS coil indicates sham stimulation while the black coil indicates active stimulation. D. Similar inputs were used at the source level. The distance between the electrodes was replaced with crosstalk. The white circle illustrates the TMS target (RM1), the red TMS coil indicates sham stimulation while the black coil indicates active stimulation.

