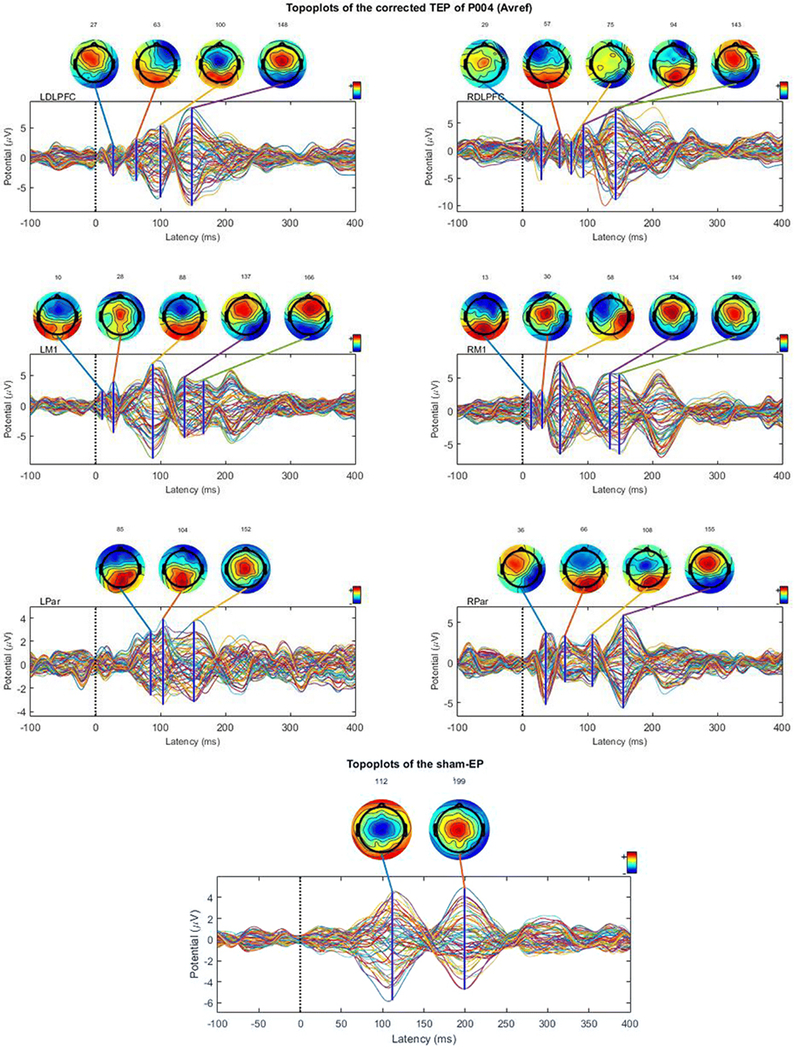
Figure 2.
Sham-corrected time series of the TEPs elicited at the 6 different stimulation sites and the sham EP are shown for a representative participant. The sham-corrected time series have been obtained by subtracting the sham-EP from the raw TEP time series. Topoplots are constructed from the time series data at different time points, which are based on peaks in the GMFP of the EP.

