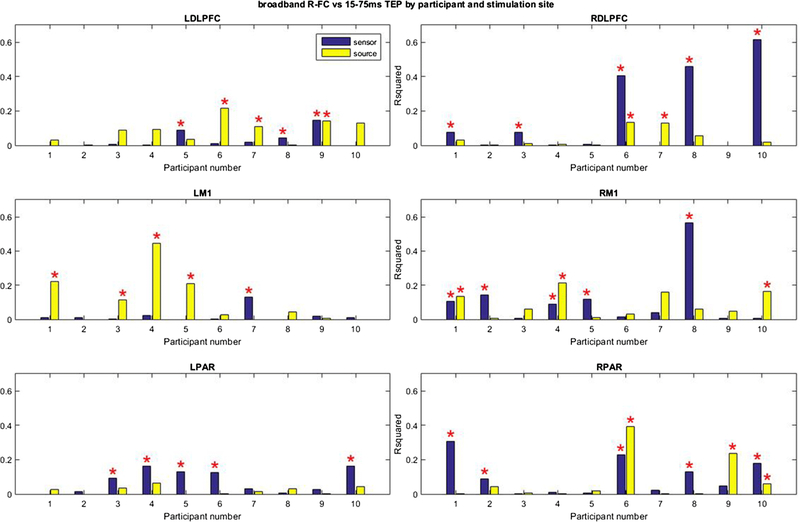
Figure 8.
Proportion of the variance of the spatial distribution of early TEP activity explained by Pearson’s correlation based FC (R-FC) at the sensor and source level for individual participants. The error bar indicates the standard deviation. *Significant contribution of ICC (p < 0.05, uncorrected).

