Figure 6.

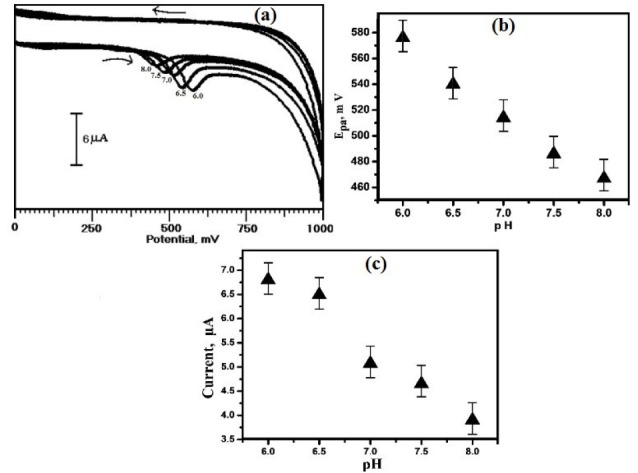
(a) CVs obtained using the OXL-9MGPE for the voltammetric response of 1×10⁻⁴ M ERL changing with pH from 6.0-8.0, at the potential scan rate 100 mVs-1, (b) The graphical plot of Epa vs. pH, (c) The plot of Ipa vs. pH.

(a) CVs obtained using the OXL-9MGPE for the voltammetric response of 1×10⁻⁴ M ERL changing with pH from 6.0-8.0, at the potential scan rate 100 mVs-1, (b) The graphical plot of Epa vs. pH, (c) The plot of Ipa vs. pH.