. 2020 Feb 18;10(2):247–253. doi: 10.34172/apb.2020.029
© 2020 The Authors.
This is an Open Access article distributed under the terms of the Creative Commons Attribution (CC BY), which permits unrestricted use, distribution, and reproduction in any medium, as long as the original authors and source are cited. No permission is required from the authors or the publishers.
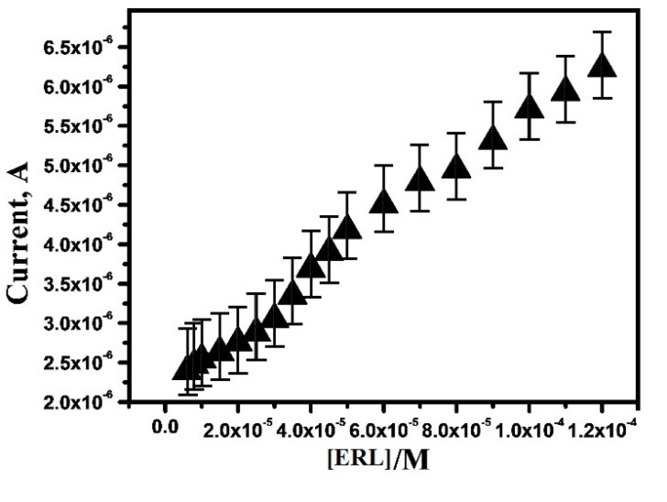
Figure 7.

The graphical plot of Ipa vs. concentration of ERL.
