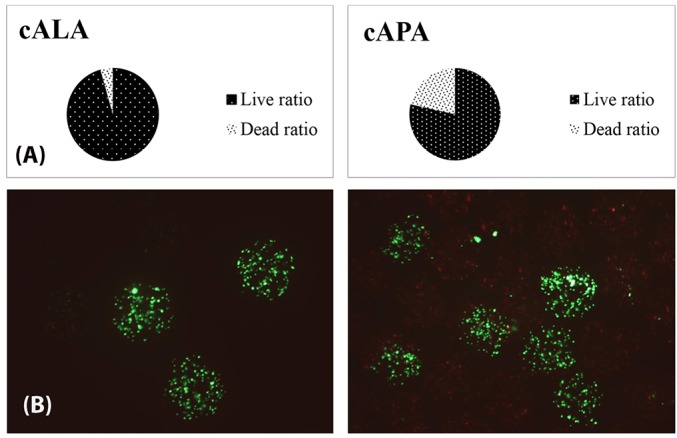
Figure 4.

(A) Quantified representation of cell Survival 1 day after microencapsulation, P < 0.05, (n=3). (B), Fluorescence microscope images (merged) of encapsulated cells stained with FDA (green) and PI (red), 1 day after microencapsulation, left, cell-loaded alginate-linear poly ethylene imine-alginate (cALA), right, cell-loaded alginate-poly l lysine-alginate (cAPA).
