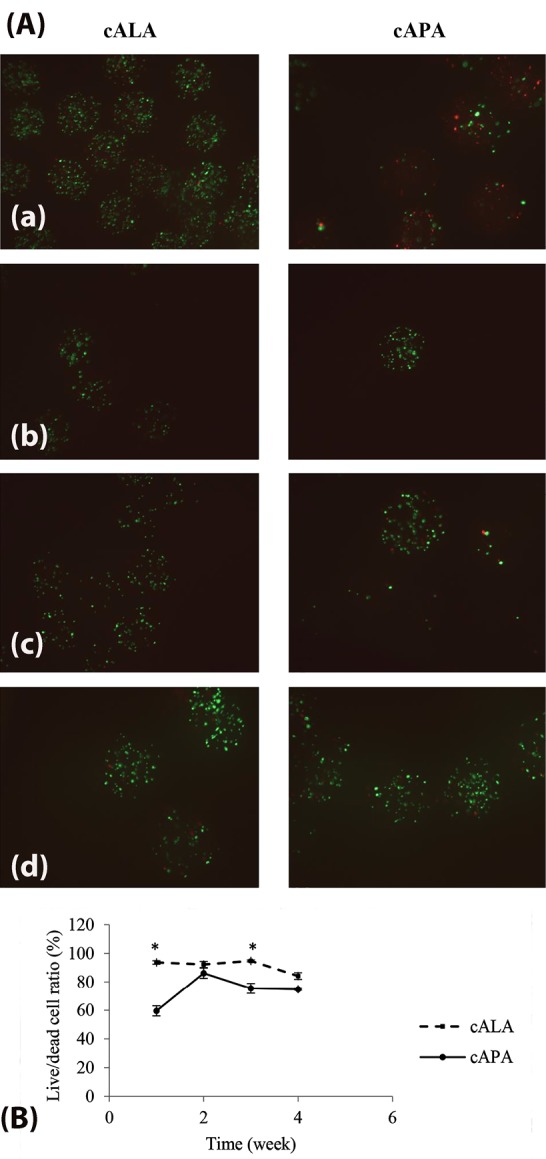
Figure 5.

(A) Fluorescence microscope images (merged) of encapsulated cells stained with FDA (green) and PI (red), (a), first week,.(b), second week, (c) third week and (d) fourth week post-encapsulation. (B) Quantitative representation of the live/dead cells ratio within 4 weeks. Results are expressed as mean± SD, (n = 3), *P<0.05, cALA: cell-loaded alginate-linear poly ethylene imine-alginate, cAPA: cell-loaded alginate-poly l lysine-alginate (cAPA).
