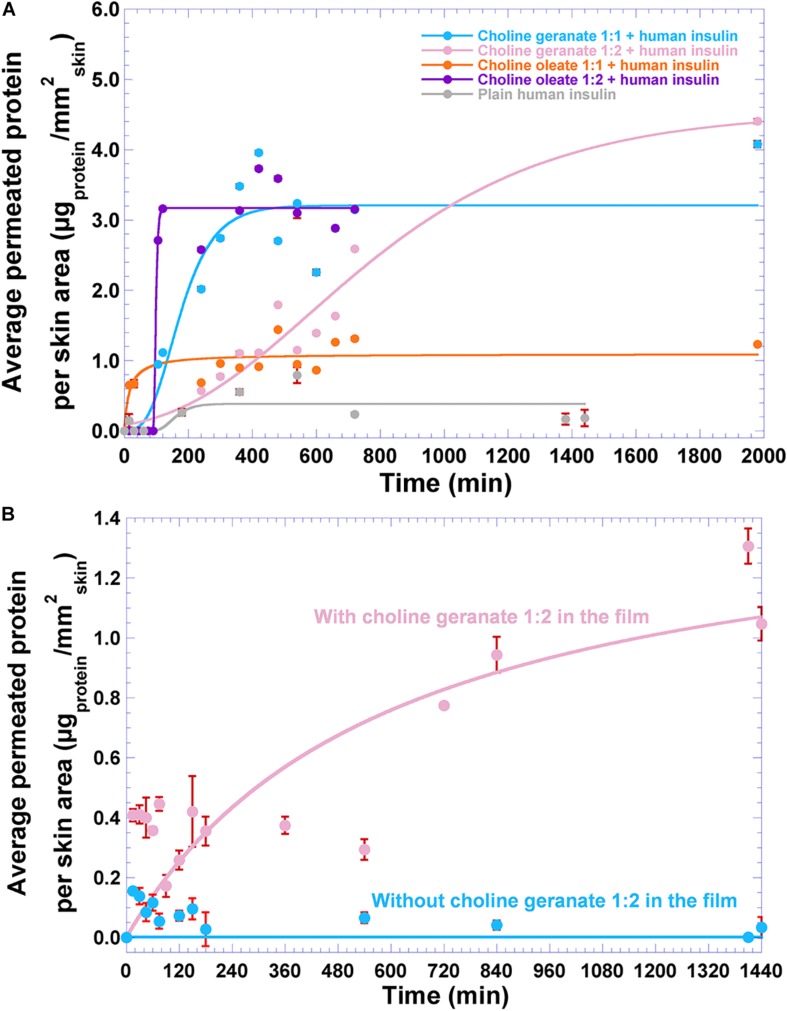
FIGURE 12.
Results gathered from transdermal permeation studies, as (A) average permeated protein (insulin NOVOLIN® N) per skin area using plain ionic liquids, and (B) average permeated protein (insulin NOVOLIN® N) per skin area from the biofilm integrating insulin and choline geranate 1:2, during a 24 h-timeframe assay. Values are the means of three experiments (n = 3), with associated standard deviations. Solid lines represent non-linear fittings performed to the data, viz. hyperbolic for the transdermal permeation data using plain choline oleate 1:1 and for the transdermal permeation data using the biofilm integrating insulin and choline geranate 1:2, and Gompertz function for all other permeation assays.

