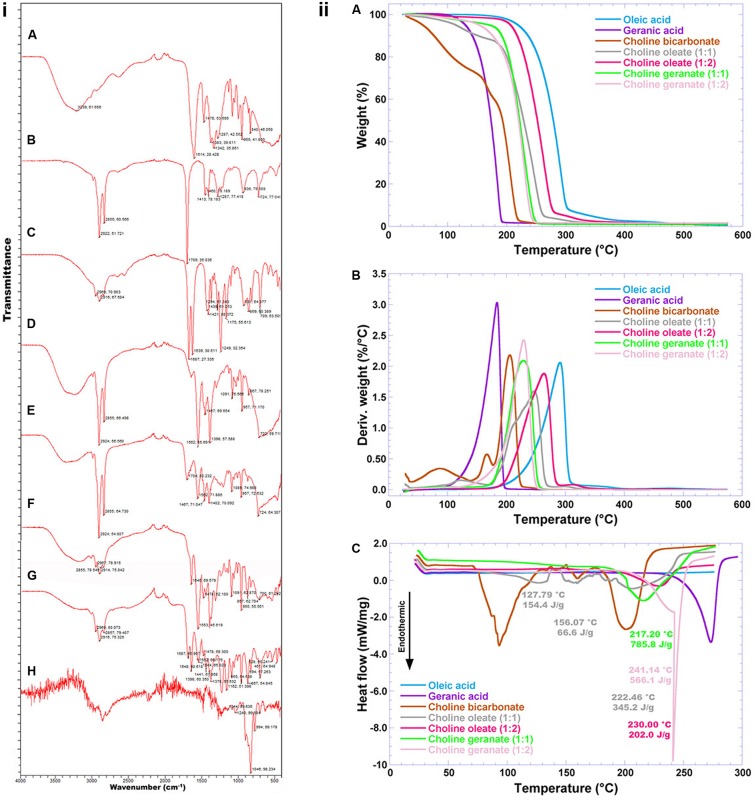
FIGURE 7.
(i) FTIR spectra of (A) choline bicarbonate, (B) oleic acid, (C) geranic acid, (D) choline oleate 1:1, (E) choline oleate 1:2, (F) choline geranate 1:1, (G) choline geranate 1:2, and (H) human insulin (NOVOLIN® N); (ii) Thermogravimetric curves (A), 1st derivative of the weight loss curves (B), and differential scanning calorimetry thermograms of plain ionic liquids and their base reactants. The analyses were carried out in a differential scanning microcalorimeter from TA Instruments (model MDSC 2910, New Castle, DE, United States), using high-pressure aluminum pans duly sealed by pressure.

