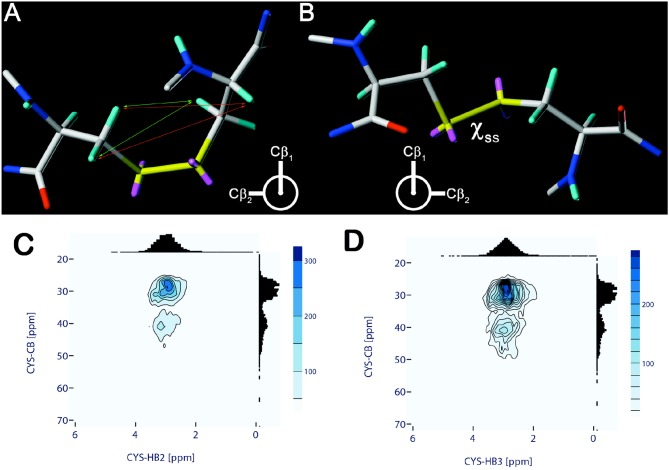
Figure 1.
Chiralities of the disulfide bridge with χS−S torsional angle values of −90° (A) and +90° (B). Coloring: H—cyan, C—gray, O—red, N—blue, S—yellow, free electron pairs—magenta. In (A) distance relations leading to typical cross peaks in NOESY-type spectra are marked (small arrows). Distance relations originating either from the Hα (orange) or the Hβ protons (green) are indicated only for one of the two cysteines. (C,D) Chemical shift correlation of cysteine Cβ and Hβ2 (C), Hβ3 (D), respectively. Chemical shift data and correlations are obtained and visualized from the Biological Magnetic Resonance Data Bank (BMRB) using a modified PyBMRB python module. Distribution values which are outside 10 times the standard deviation were removed from each correlation data set. Contour levels reflect the total number of correlations within.

