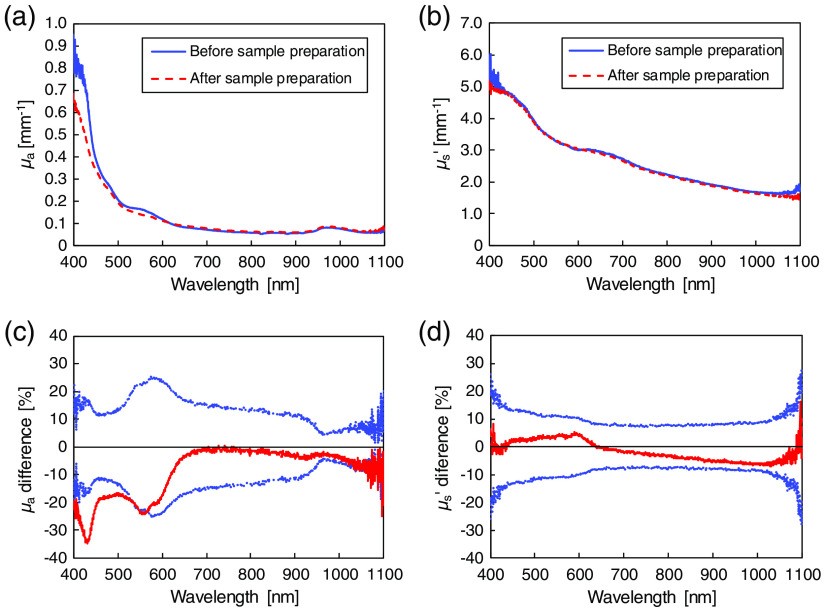
Fig. 4.
(a), (b) Wavelength dependences of and of epidermis + dermis before and after sample preparation. The solid and broken lines show the values before and after sample preparation, respectively. (c), (d) Spectral dependences of the relative differences between the and of epidermis + dermis before and after the sample preparation. The solid line and dotted lines represent the relative differences of the and , with ±1 SD, respectively.

