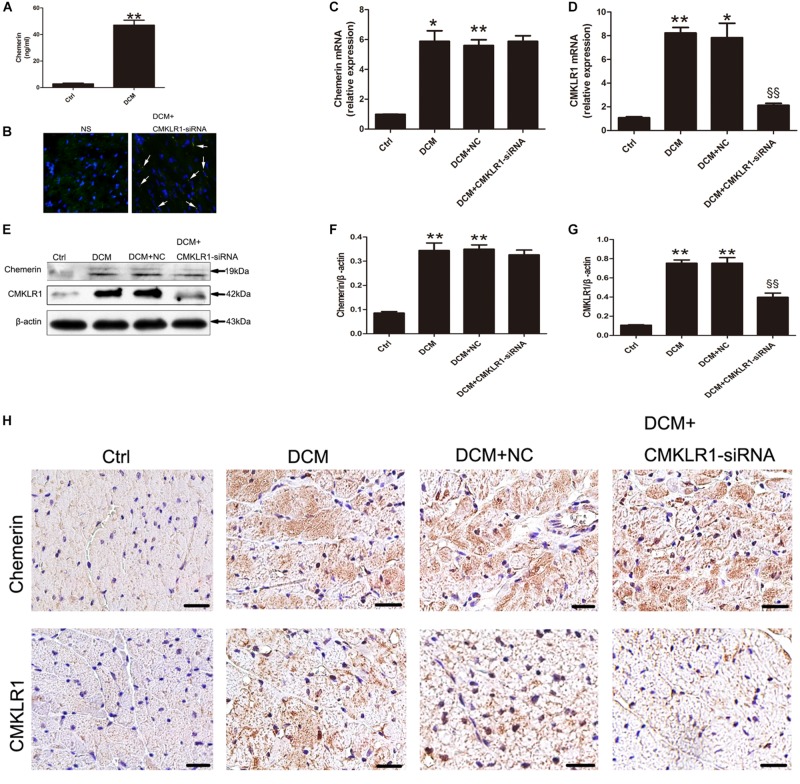
FIGURE 1.
The expression of chemerin and CMKLR1 in diabetic cardiomyopathy (DCM) rats. (A) The serum levels of chemerin in the control and DCM groups. (B) Transfection efficiency of CMKLR1-siRNA in myocardium. Bright green points (white arrow) indicate GFP with lentivirus-CMKLR1-siRNA (scale bar: 20 μm). Relative mRNA (C–D) and protein (E–G) expression of chemerin and CMKLR1 in cardiac tissue with CMKLR1-siRNA treatment. Immunohistochemical staining (H) of chemerin and CMKLR1 in the different groups; scale bar: 20 μm. Data were presented as means ± SEM, n = 4–6. *p < 0.05, **p < 0.01 vs. Ctrl; §§ p < 0.01 vs. DCM+NC. NC, negative control.

