FIGURE 3.
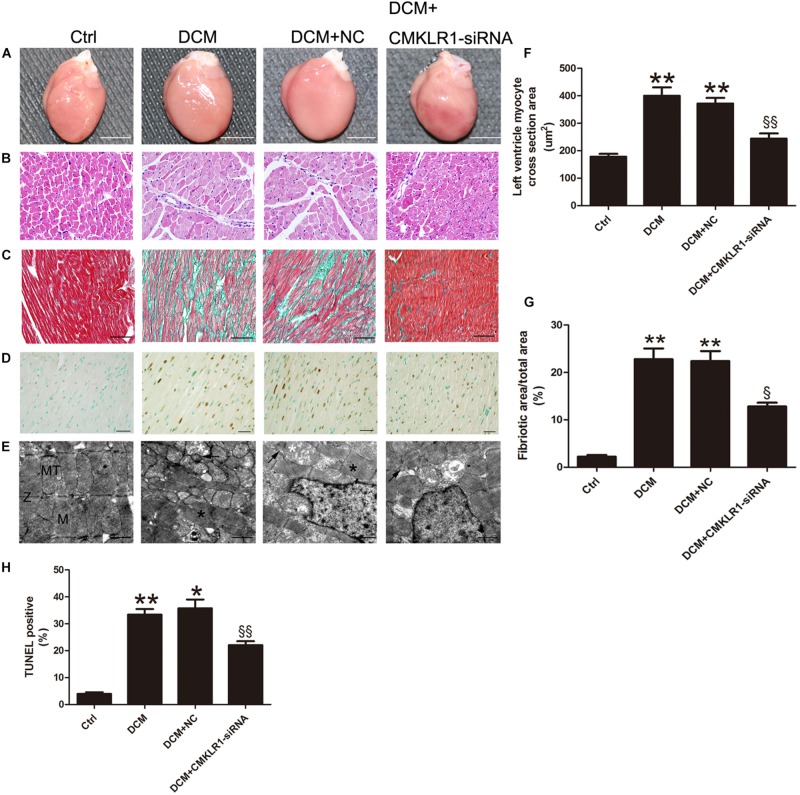
CMKLR1 gene silencing reversed myocardial remodeling in diabetic cardiomyopathy (DCM) rats. (A) Heart size in the different groups; scale bar: 5 mm. (B) Hematoxylin and eosin (H&E) staining; scale bar: 20 μm. (C) Masson’s staining: fibrotic areas are stained green and normal cardiac myocytes are stained red; scale bar: 50 μm. (D) TUNEL staining of myocardium: dark brown staining indicates fragmented nuclear DNA; scale bar: 20 μm. (E) Transmission electron microscopy of rat hearts; M, normal myofibrils; MT, normal mitochondria; Z, normal Z-lines; black asterisk: disorganized myofibrils; white asterisk: swollen mitochondria; black arrow: accumulated lipids; scale bar: 1 μm. (F) Quantitative analysis of the cross-section area in H&E staining. (G) Quantitative analysis of the ratio of fibrotic area to total area. (H) Quantitative analysis of TUNEL-positive cells in each group. Data were presented as means ± SEM, n = 4–6. * p < 0.05 vs. Ctrl; ** p < 0.01 vs. Ctrl; § p < 0.05 vs. DCM+NC; §§ p < 0.01 vs. DCM+NC.. NC, negative control.

