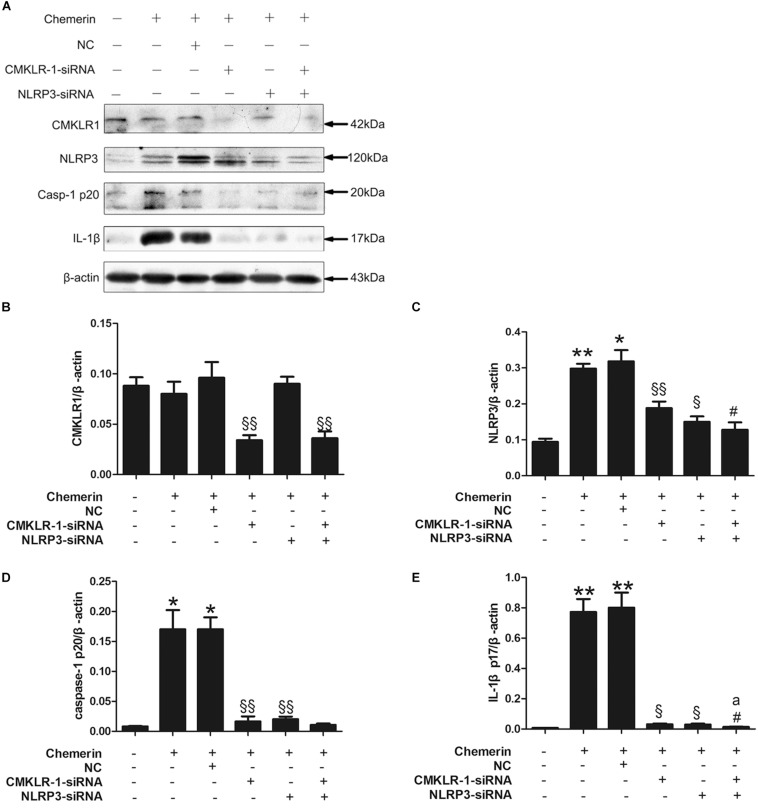
FIGURE 6.
CMKLR1 and NLRP3 induced caspase-1 and IL-1β activation. Relative protein levels of CMKLR1 (A,B), NLRP3 (A,C), activated caspase-1 (A,D), and mature IL-1β (A,E) in treated H9c2 cells. Data were presented as means ± SEM from three independent experiments. *p < 0.05, **p < 0.01 vs. Ctrl; § p < 0.05, §§ p < 0.01 vs. Chemerin+NC; #p < 0.05 vs. Chemerin+CMKLR1-siRNA; ap < 0.05 vs. Chemerin+NLRP3-siRNA; NC, negative control.

