Figure 1.

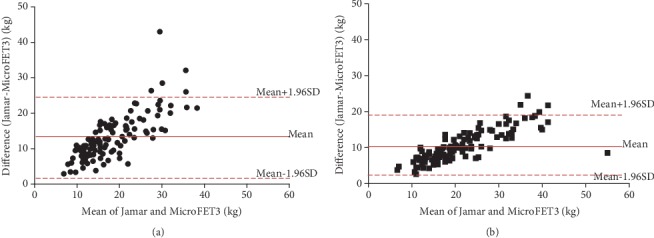
Bland-Altman plot of the mean and difference between the Jamar and MicroFET3 dynamometers for the (a) dominant and (b) nondominant hands in all participants. Biases were 13 kg in the dominant hand and 10 kg in the nondominant hand.

Bland-Altman plot of the mean and difference between the Jamar and MicroFET3 dynamometers for the (a) dominant and (b) nondominant hands in all participants. Biases were 13 kg in the dominant hand and 10 kg in the nondominant hand.